Estimated Value: $153,000 - $230,812
2
Beds
1
Bath
1,288
Sq Ft
$148/Sq Ft
Est. Value
About This Home
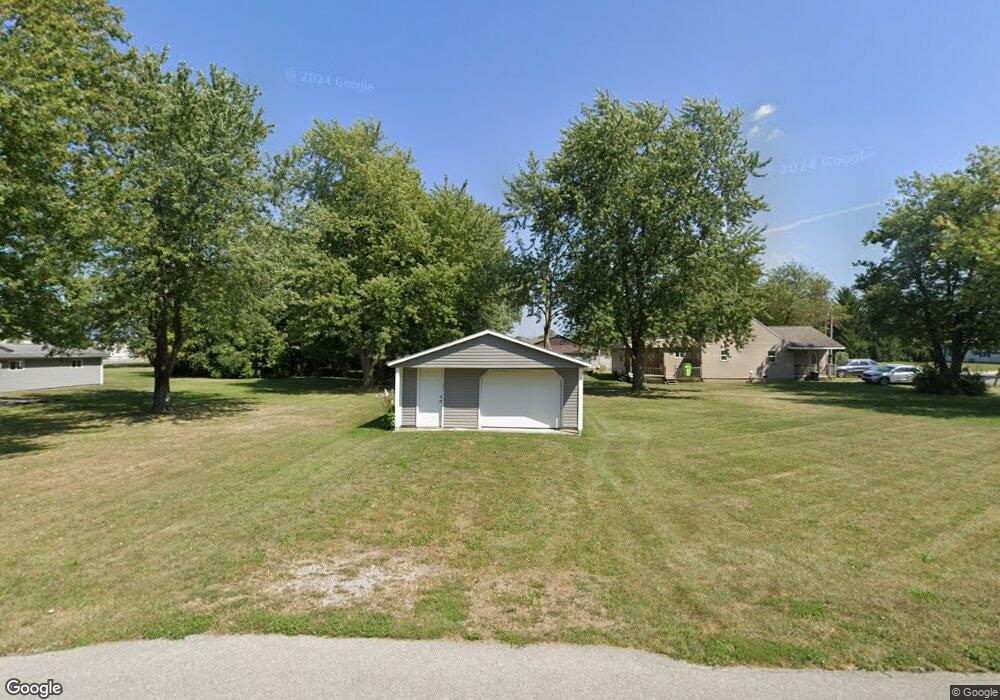
This home is located at 358 Lester Ave, Lima, OH 45801 and is currently estimated at $190,453, approximately $147 per square foot. 358 Lester Ave is a home located in Allen County with nearby schools including Elida Elementary School, Elida Middle School, and Elida High School.
Ownership History
Date
Name
Owned For
Owner Type
Purchase Details
Closed on
Nov 29, 2024
Sold by
Catahoula Fd Llc
Bought by
Thompson Ellen Dena and Thompson Harry Linwood
Current Estimated Value
Home Financials for this Owner
Home Financials are based on the most recent Mortgage that was taken out on this home.
Original Mortgage
$184,000
Outstanding Balance
$182,452
Interest Rate
6.44%
Mortgage Type
New Conventional
Estimated Equity
$8,001
Purchase Details
Closed on
Aug 2, 2024
Sold by
Falco Dena M and Falco Korby D
Bought by
Hughes Ronnie D and Hughes Brenda L
Purchase Details
Closed on
May 6, 2013
Sold by
Hughes Ronnie D and Hughes Brenda L
Bought by
Falco Dena M
Purchase Details
Closed on
Apr 23, 2013
Sold by
Everett Doris
Bought by
Hughes Ronnie D and Hughes Brenda L
Purchase Details
Closed on
Mar 3, 1986
Bought by
Early Marjorie G
Create a Home Valuation Report for This Property
The Home Valuation Report is an in-depth analysis detailing your home's value as well as a comparison with similar homes in the area
Purchase History
| Date | Buyer | Sale Price | Title Company |
|---|---|---|---|
| Thompson Ellen Dena | $230,000 | None Listed On Document | |
| Thompson Ellen Dena | $230,000 | None Listed On Document | |
| Hughes Ronnie D | -- | None Listed On Document | |
| Falco Dena M | -- | None Available | |
| Hughes Ronnie D | $6,000 | None Available | |
| Early Marjorie G | -- | -- |
Source: Public Records
Mortgage History
| Date | Status | Borrower | Loan Amount |
|---|---|---|---|
| Open | Thompson Ellen Dena | $184,000 | |
| Closed | Thompson Ellen Dena | $184,000 |
Source: Public Records
Tax History
| Year | Tax Paid | Tax Assessment Tax Assessment Total Assessment is a certain percentage of the fair market value that is determined by local assessors to be the total taxable value of land and additions on the property. | Land | Improvement |
|---|---|---|---|---|
| 2024 | $248 | $5,400 | $4,170 | $1,230 |
| 2023 | $272 | $5,120 | $3,960 | $1,160 |
| 2022 | $269 | $5,080 | $3,920 | $1,160 |
| 2021 | $270 | $5,080 | $3,920 | $1,160 |
| 2020 | $314 | $5,570 | $3,710 | $1,860 |
| 2019 | $314 | $5,570 | $3,710 | $1,860 |
| 2018 | $311 | $5,570 | $3,710 | $1,860 |
| 2017 | $296 | $5,390 | $3,710 | $1,680 |
| 2016 | $296 | $5,390 | $3,710 | $1,680 |
| 2015 | $273 | $5,390 | $3,710 | $1,680 |
| 2014 | $273 | $4,870 | $3,570 | $1,300 |
| 2013 | $367 | $7,460 | $3,570 | $3,890 |
Source: Public Records
Map
Nearby Homes
- 520 Kenmore St
- 475 Kenmore St
- 3137 Thorndyke Dr
- 2371 Mandolin Dr
- 1705 Karen St
- 2300 Mandolin Dr
- 105 Watt Ave
- 2718 Carolyn Dr
- 1924 Burch Ave
- 400 W Northern Ave
- 2630 Carolyn Dr
- 3270 Bonnieview Dr
- 207 W Lane Ave
- 128 E Lane Ave
- 1743 Sherry Lee Dr
- 1720 Brookwood Dr
- 1317 Virginia Ave
- 0 Fraunfelter Unit 307817
- 0 N Eastown Rd Unit 1034495
- 2511 Debbie Dr