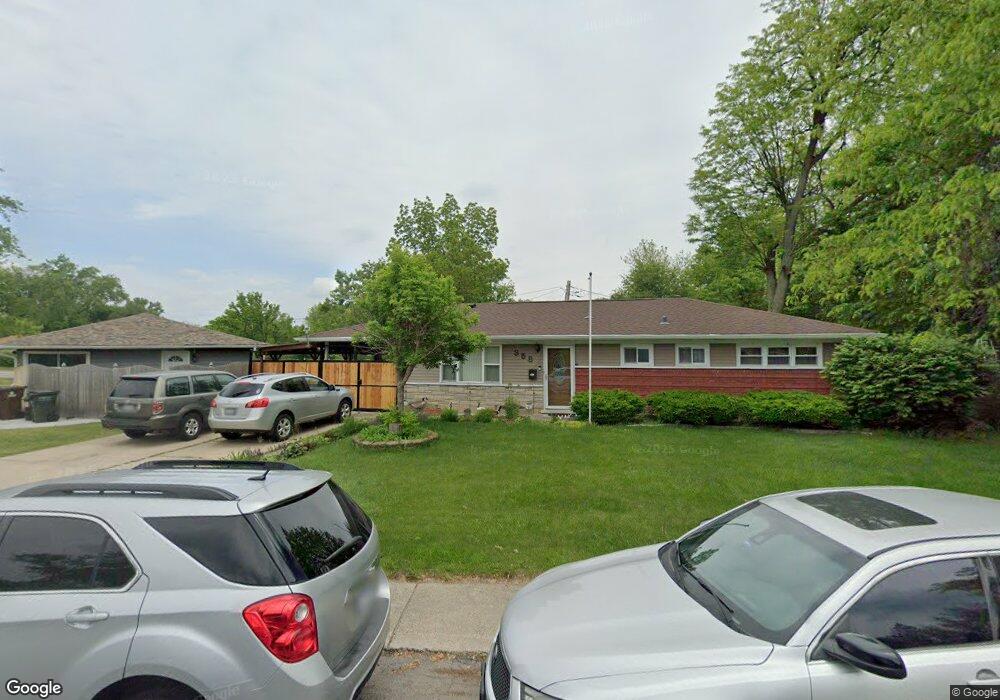
358 Minocqua St Park Forest, IL 60466
Estimated Value: $123,000 - $173,000
3
Beds
2
Baths
1,170
Sq Ft
$127/Sq Ft
Est. Value
About This Home
This home is located at 358 Minocqua St, Park Forest, IL 60466 and is currently estimated at $148,354, approximately $126 per square foot. 358 Minocqua St is a home located in Cook County with nearby schools including Michelle Obama School of Technology, Mohawk Primary Center, and Barack Obama School of Leadership and STEM.
Ownership History
Date
Name
Owned For
Owner Type
Purchase Details
Closed on
Jun 29, 2019
Sold by
Ferrel Lourdes
Bought by
Bandera Rodriguez Rosa B and Garcia Abel
Current Estimated Value
Purchase Details
Closed on
Jul 6, 2016
Sold by
Ferrel Lourdes and Ferrel Manuel
Bought by
Ferrel Lourdes and Garcia Abel
Purchase Details
Closed on
Jul 1, 2005
Sold by
Zahn Amanda and Hendron Amanda K
Bought by
Ferrel Lourdes
Home Financials for this Owner
Home Financials are based on the most recent Mortgage that was taken out on this home.
Original Mortgage
$70,000
Interest Rate
5.69%
Mortgage Type
Fannie Mae Freddie Mac
Purchase Details
Closed on
Jun 21, 2002
Sold by
Zahn Marian D
Bought by
Hendron Amanda K
Home Financials for this Owner
Home Financials are based on the most recent Mortgage that was taken out on this home.
Original Mortgage
$68,000
Interest Rate
6.93%
Create a Home Valuation Report for This Property
The Home Valuation Report is an in-depth analysis detailing your home's value as well as a comparison with similar homes in the area
Home Values in the Area
Average Home Value in this Area
Purchase History
| Date | Buyer | Sale Price | Title Company |
|---|---|---|---|
| Bandera Rodriguez Rosa B | -- | None Available | |
| Ferrel Lourdes | -- | None Available | |
| Ferrel Lourdes | $95,000 | Cti | |
| Hendron Amanda K | $85,000 | -- |
Source: Public Records
Mortgage History
| Date | Status | Borrower | Loan Amount |
|---|---|---|---|
| Previous Owner | Ferrel Lourdes | $70,000 | |
| Previous Owner | Hendron Amanda K | $68,000 |
Source: Public Records
Tax History Compared to Growth
Tax History
| Year | Tax Paid | Tax Assessment Tax Assessment Total Assessment is a certain percentage of the fair market value that is determined by local assessors to be the total taxable value of land and additions on the property. | Land | Improvement |
|---|---|---|---|---|
| 2024 | $7,089 | $11,685 | $2,883 | $8,802 |
| 2023 | $3,139 | $13,000 | $2,883 | $10,117 |
| 2022 | $3,139 | $5,755 | $2,677 | $3,078 |
| 2021 | $3,199 | $5,755 | $2,677 | $3,078 |
| 2020 | $6,923 | $5,755 | $2,677 | $3,078 |
| 2019 | $3,337 | $6,495 | $2,471 | $4,024 |
| 2018 | $3,209 | $6,495 | $2,471 | $4,024 |
| 2017 | $6,771 | $6,495 | $2,471 | $4,024 |
| 2016 | $6,260 | $6,297 | $2,265 | $4,032 |
| 2015 | $6,118 | $6,297 | $2,265 | $4,032 |
| 2014 | $5,938 | $6,297 | $2,265 | $4,032 |
| 2013 | $5,745 | $6,800 | $2,265 | $4,535 |
Source: Public Records
Map
Nearby Homes
- 363 Minocqua St
- 344 Sauk Trail
- 340 Sauk Trail
- 374 Sauk Trail
- 336 Marquette St
- 569 Lakewood Blvd
- 323 Windsor St
- 332 Mohawk St
- 574 Lakewood Blvd
- 9 Lakewood Ct
- 403 Wilshire St
- 406 Sauk Trail
- 409 Wilshire St
- 408 Sauk Trail
- 413 Wilshire St
- 318 Marquette St
- 419 Suwanee St
- 308 Minocqua St
- 329 Blackhawk Dr
- 354 Winona St
- 356 Minocqua St
- 360 Minocqua St
- 355 Sauk Trail
- 354 Minocqua St
- 353 Sauk Trail
- 361 Minocqua St
- 359 Minocqua St
- 357 Minocqua St
- 352 Minocqua St
- 365 Minocqua St
- 351 Sauk Trail
- 355 Minocqua St
- 349 Sauk Trail
- 353 Minocqua St
- 370 Miami St
- 350 Minocqua St
- 356 Marquette St
- 360 Sauk Trail
- 368 Miami St
- 366 Miami St