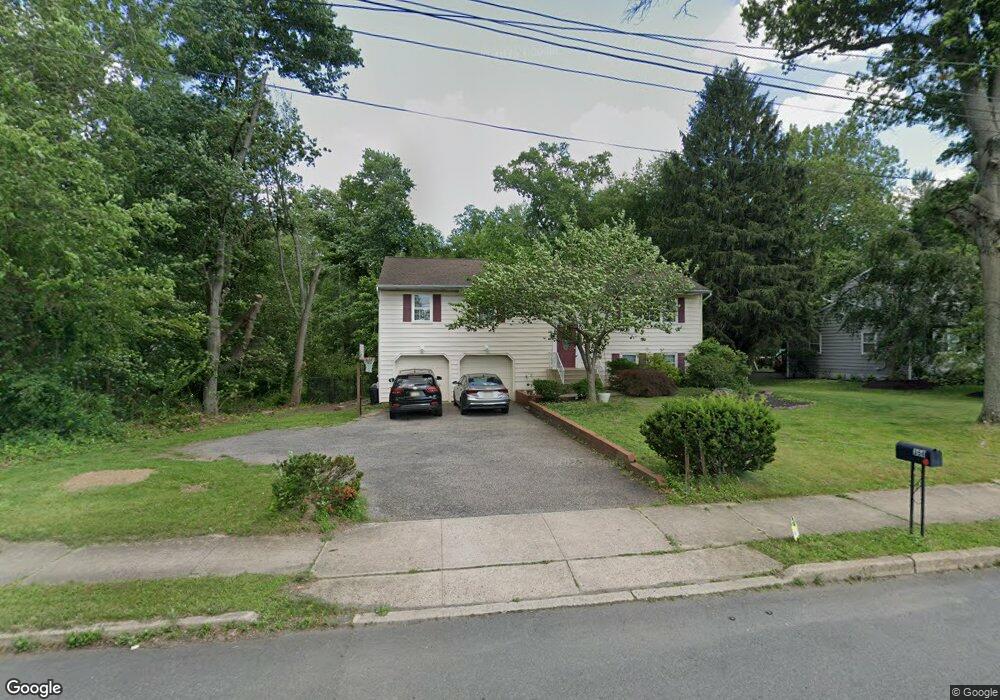
358 N Post Rd Princeton Junction, NJ 08550
Estimated Value: $770,000 - $956,000
4
Beds
3
Baths
2,208
Sq Ft
$382/Sq Ft
Est. Value
About This Home
This home is located at 358 N Post Rd, Princeton Junction, NJ 08550 and is currently estimated at $842,489, approximately $381 per square foot. 358 N Post Rd is a home located in Mercer County with nearby schools including Maurice Hawk Elementary School, Village Elementary School, and Thomas R. Grover Middle School.
Ownership History
Date
Name
Owned For
Owner Type
Purchase Details
Closed on
May 6, 2011
Sold by
Roma Bank
Bought by
Ye David Shengnian and Jin Min
Current Estimated Value
Purchase Details
Closed on
Oct 28, 2010
Sold by
Dileo Thomas and Dileo Cynthia
Bought by
Roma Bank
Purchase Details
Closed on
Jul 22, 2002
Sold by
Larnice Shannon
Bought by
Dileo Thomas and Dileo Cynthia
Home Financials for this Owner
Home Financials are based on the most recent Mortgage that was taken out on this home.
Original Mortgage
$230,000
Interest Rate
6.73%
Create a Home Valuation Report for This Property
The Home Valuation Report is an in-depth analysis detailing your home's value as well as a comparison with similar homes in the area
Home Values in the Area
Average Home Value in this Area
Purchase History
| Date | Buyer | Sale Price | Title Company |
|---|---|---|---|
| Ye David Shengnian | $305,000 | None Available | |
| Roma Bank | -- | None Available | |
| Dileo Thomas | $330,000 | -- |
Source: Public Records
Mortgage History
| Date | Status | Borrower | Loan Amount |
|---|---|---|---|
| Previous Owner | Dileo Thomas | $230,000 |
Source: Public Records
Tax History Compared to Growth
Tax History
| Year | Tax Paid | Tax Assessment Tax Assessment Total Assessment is a certain percentage of the fair market value that is determined by local assessors to be the total taxable value of land and additions on the property. | Land | Improvement |
|---|---|---|---|---|
| 2025 | $11,852 | $386,700 | $199,300 | $187,400 |
| 2024 | $11,357 | $386,700 | $199,300 | $187,400 |
| 2023 | $11,357 | $386,700 | $199,300 | $187,400 |
| 2022 | $11,137 | $386,700 | $199,300 | $187,400 |
| 2021 | $11,044 | $386,700 | $199,300 | $187,400 |
| 2020 | $10,843 | $386,700 | $199,300 | $187,400 |
| 2019 | $10,719 | $386,700 | $199,300 | $187,400 |
| 2018 | $10,619 | $386,700 | $199,300 | $187,400 |
| 2017 | $10,398 | $386,700 | $199,300 | $187,400 |
| 2016 | $10,174 | $386,700 | $199,300 | $187,400 |
| 2015 | $9,938 | $386,700 | $199,300 | $187,400 |
| 2014 | $9,822 | $386,700 | $199,300 | $187,400 |
Source: Public Records
Map
Nearby Homes
- 298 N Post Rd
- 1 Hawk Dr
- 10 Norbridge Dr
- 3 Yorktowne Ct
- 9 Wedgewood Ct
- 24 Hereford Dr
- 951 Alexander Rd
- 40 Caleb Ln
- 43 Wallace Rd
- 53 E Shrewsbury Place
- 103 Harris Rd
- 90 Bear Brook Rd
- 2 Corio Ct
- 1 Corio Ct
- 8 Corio Ct
- 90 Princeton Hightstown Rd
- 5 Corio Ct
- 10 Corio Ct
- 3103 Justin Dr
- 1005 Justin Dr Unit 1002