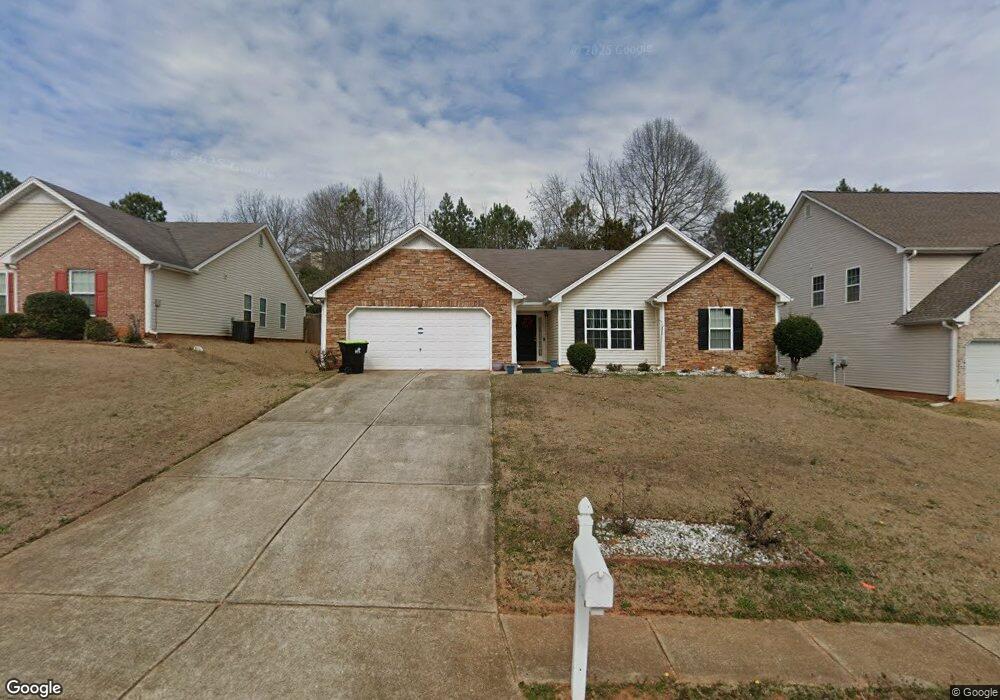
358 Oakhaven Way Unit 131 Villa Rica, GA 30180
Estimated Value: $318,000 - $336,771
4
Beds
2
Baths
2,171
Sq Ft
$151/Sq Ft
Est. Value
About This Home
This home is located at 358 Oakhaven Way Unit 131, Villa Rica, GA 30180 and is currently estimated at $327,693, approximately $150 per square foot. 358 Oakhaven Way Unit 131 is a home located in Carroll County with nearby schools including Ithica Elementary School, Bay Springs Middle School, and Villa Rica High School.
Ownership History
Date
Name
Owned For
Owner Type
Purchase Details
Closed on
Apr 26, 2017
Sold by
Patel Thakorbhai
Bought by
Heard Ralph C and Heard Joann E
Current Estimated Value
Home Financials for this Owner
Home Financials are based on the most recent Mortgage that was taken out on this home.
Original Mortgage
$149,000
Outstanding Balance
$124,048
Interest Rate
4.14%
Mortgage Type
New Conventional
Estimated Equity
$203,645
Purchase Details
Closed on
Dec 19, 2014
Sold by
Cortez Raymon
Bought by
Patel Thakorbhai T and Patel Jasooben T
Purchase Details
Closed on
Jun 15, 2006
Sold by
Noble Builders Inc
Bought by
Cortes Ramon
Purchase Details
Closed on
Oct 17, 2003
Sold by
Vbc Properties Llc
Bought by
Belans Properties Inc
Purchase Details
Closed on
Aug 19, 2003
Bought by
Adh Development Inc
Purchase Details
Closed on
Jul 28, 2003
Sold by
Adh Dev
Bought by
Progressive Ent Unlimited
Create a Home Valuation Report for This Property
The Home Valuation Report is an in-depth analysis detailing your home's value as well as a comparison with similar homes in the area
Home Values in the Area
Average Home Value in this Area
Purchase History
| Date | Buyer | Sale Price | Title Company |
|---|---|---|---|
| Heard Ralph C | $157,000 | -- | |
| Patel Thakorbhai T | $127,000 | -- | |
| Cortes Ramon | $158,900 | -- | |
| Belans Properties Inc | $3,502,000 | -- | |
| Vbc Properties Llc | $2,987,000 | -- | |
| Noble Builders Inc | $1,836,000 | -- | |
| Adh Development Inc | -- | -- | |
| Progressive Ent Unlimited | -- | -- |
Source: Public Records
Mortgage History
| Date | Status | Borrower | Loan Amount |
|---|---|---|---|
| Open | Heard Ralph C | $149,000 |
Source: Public Records
Tax History Compared to Growth
Tax History
| Year | Tax Paid | Tax Assessment Tax Assessment Total Assessment is a certain percentage of the fair market value that is determined by local assessors to be the total taxable value of land and additions on the property. | Land | Improvement |
|---|---|---|---|---|
| 2024 | $2,965 | $118,377 | $10,000 | $108,377 |
| 2023 | $2,965 | $125,462 | $10,000 | $115,462 |
| 2022 | $2,724 | $95,376 | $10,000 | $85,376 |
| 2021 | $2,475 | $83,052 | $10,000 | $73,052 |
| 2020 | $2,421 | $80,722 | $10,000 | $70,722 |
| 2019 | $2,230 | $73,810 | $10,000 | $63,810 |
| 2018 | $2,029 | $64,034 | $10,000 | $54,034 |
| 2017 | $1,739 | $53,166 | $10,000 | $43,166 |
| 2016 | $1,747 | $53,166 | $10,000 | $43,166 |
| 2015 | $1,538 | $44,617 | $10,000 | $34,617 |
| 2014 | $1,549 | $44,617 | $10,000 | $34,617 |
Source: Public Records
Map
Nearby Homes
- 534 Great Oak Place
- 371 Oakhaven Way
- 737 Great Oak Place
- 738 Great Oak Place
- 818 Major Oak Ct Unit 64
- 818 Major Oak Ct
- 742 Great Oak Place
- 745 Great Oak Place
- 746 Great Oak Place
- 735 Great Oak Place Unit 74
- Tucker FP Plan at Twin Oaks
- Mira Plan at Twin Oaks
- Jodeco FP Plan at Twin Oaks
- The Maddux II Plan at Jameson Towns
- The Ellison II Plan at Jameson Towns
- The Norwood II Plan at Jameson Towns
- 645 Amberwood Dr
- 768 Great Oak Place
- 768 Great Oak Place Unit 26
- 126 Ashbury Dr
- 358 Oakhaven Way Unit 38
- 358 Oakhaven Way
- 364 Oakhaven Way
- 352 Oakhaven Way
- 525 Great Oak Place
- 370 Oakhaven Way
- 346 Oakhaven Way
- 531 Great Oak Place Unit 51
- 531 Great Oak Place
- 0 Oakhaven Way Unit 3142674
- 0 Oakhaven Way Unit 8958207
- 0 Oakhaven Way Unit 8747518
- 0 Oakhaven Way Unit 8753467
- 0 Oakhaven Way Unit 8768125
- 0 Oakhaven Way Unit 8830307
- 0 Oakhaven Way Unit 3168781
- 0 Oakhaven Way Unit 3188960
- 0 Oakhaven Way Unit 7073227
- 0 Oakhaven Way Unit 7453080
- 0 Oakhaven Way Unit 7504061