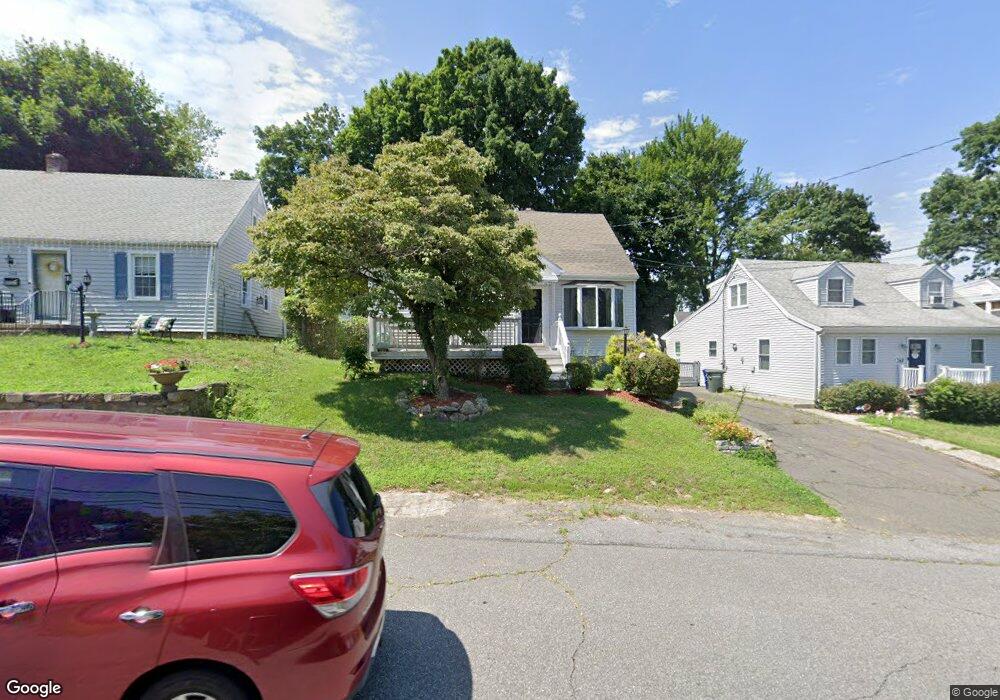
358 Queen St Bridgeport, CT 06606
North End NeighborhoodEstimated Value: $395,000 - $411,262
3
Beds
1
Bath
1,308
Sq Ft
$307/Sq Ft
Est. Value
About This Home
This home is located at 358 Queen St, Bridgeport, CT 06606 and is currently estimated at $401,816, approximately $307 per square foot. 358 Queen St is a home located in Fairfield County with nearby schools including Blackham School, Central High School, and Northeastern Adventist Academy - Fairfield County.
Ownership History
Date
Name
Owned For
Owner Type
Purchase Details
Closed on
Apr 3, 2006
Sold by
Leonzi Carl
Bought by
Guzman Kleber
Current Estimated Value
Home Financials for this Owner
Home Financials are based on the most recent Mortgage that was taken out on this home.
Original Mortgage
$246,050
Outstanding Balance
$163,924
Interest Rate
9.3%
Estimated Equity
$237,892
Create a Home Valuation Report for This Property
The Home Valuation Report is an in-depth analysis detailing your home's value as well as a comparison with similar homes in the area
Home Values in the Area
Average Home Value in this Area
Purchase History
| Date | Buyer | Sale Price | Title Company |
|---|---|---|---|
| Guzman Kleber | $259,000 | -- | |
| Guzman Kleber | $259,000 | -- |
Source: Public Records
Mortgage History
| Date | Status | Borrower | Loan Amount |
|---|---|---|---|
| Open | Guzman Kleber | $246,050 | |
| Closed | Guzman Kleber | $246,050 | |
| Previous Owner | Guzman Kleber | $135,000 |
Source: Public Records
Tax History
| Year | Tax Paid | Tax Assessment Tax Assessment Total Assessment is a certain percentage of the fair market value that is determined by local assessors to be the total taxable value of land and additions on the property. | Land | Improvement |
|---|---|---|---|---|
| 2025 | $6,507 | $149,760 | $75,310 | $74,450 |
| 2024 | $6,507 | $149,760 | $75,310 | $74,450 |
| 2023 | $6,507 | $149,760 | $75,310 | $74,450 |
| 2022 | $6,507 | $149,760 | $75,310 | $74,450 |
| 2021 | $6,507 | $149,760 | $75,310 | $74,450 |
| 2020 | $5,696 | $105,510 | $43,270 | $62,240 |
| 2019 | $5,696 | $105,510 | $43,270 | $62,240 |
| 2018 | $5,737 | $105,510 | $43,270 | $62,240 |
| 2017 | $5,737 | $105,510 | $43,270 | $62,240 |
| 2016 | $5,737 | $105,510 | $43,270 | $62,240 |
| 2015 | $5,961 | $141,250 | $49,980 | $91,270 |
| 2014 | $5,961 | $141,250 | $49,980 | $91,270 |
Source: Public Records
Map
Nearby Homes
- 255 Ruth St
- 375 Ruth St
- 316 Goldenrod Ave
- 415 Jewett Ave
- 604 Birmingham St
- 383 Birmingham St
- 235 Burnsford Ave
- 485 Peet St
- 646 Merritt St
- 345 Glendale Ave Unit A2
- 335 Glendale Ave Unit G11
- 1095 Wayne St
- 948 Wayne St
- 669 Queen St
- 462 Glendale Ave Unit 11
- 720 Queen St
- 120 Clark St
- 200 Woodmont Ave Unit 130
- 495 Vincellette St Unit 12
- 333 Vincellette St Unit 42
Your Personal Tour Guide
Ask me questions while you tour the home.