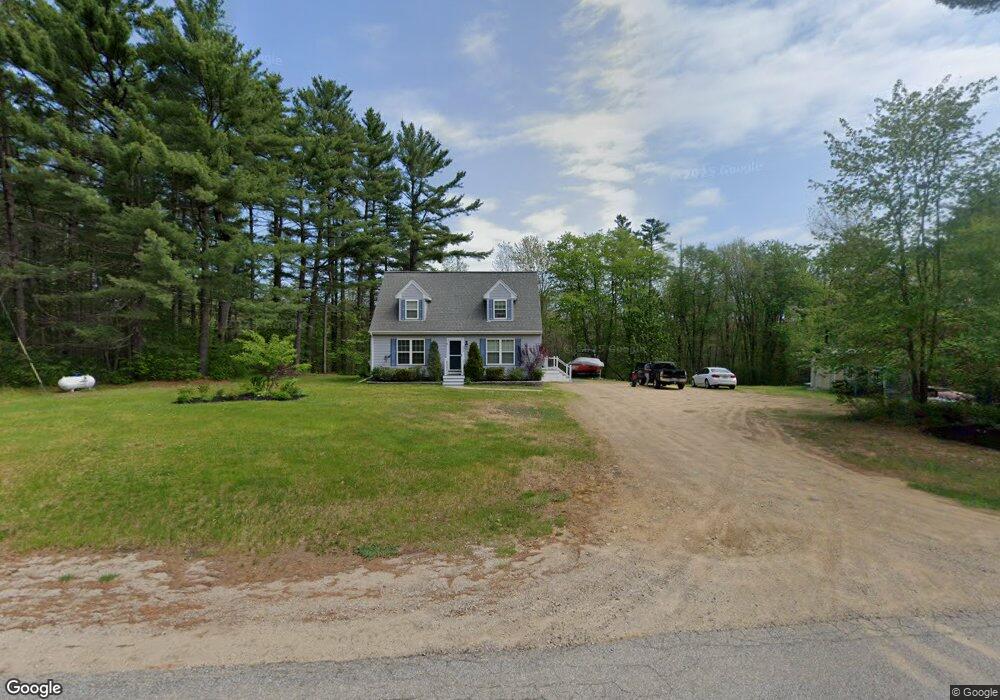
358 Ridlon Rd Berwick, ME 03901
Estimated Value: $480,902 - $516,000
4
Beds
3
Baths
1,764
Sq Ft
$282/Sq Ft
Est. Value
About This Home
This home is located at 358 Ridlon Rd, Berwick, ME 03901 and is currently estimated at $497,226, approximately $281 per square foot. 358 Ridlon Rd is a home located in York County with nearby schools including Noble High School.
Ownership History
Date
Name
Owned For
Owner Type
Purchase Details
Closed on
Jun 5, 2006
Sold by
Maddison Kelley W and Maddison James M
Bought by
Masee Jeremy R and Masse Shannon B
Current Estimated Value
Home Financials for this Owner
Home Financials are based on the most recent Mortgage that was taken out on this home.
Original Mortgage
$203,200
Outstanding Balance
$116,098
Interest Rate
6.55%
Mortgage Type
Purchase Money Mortgage
Estimated Equity
$381,128
Create a Home Valuation Report for This Property
The Home Valuation Report is an in-depth analysis detailing your home's value as well as a comparison with similar homes in the area
Home Values in the Area
Average Home Value in this Area
Purchase History
| Date | Buyer | Sale Price | Title Company |
|---|---|---|---|
| Masee Jeremy R | -- | -- |
Source: Public Records
Mortgage History
| Date | Status | Borrower | Loan Amount |
|---|---|---|---|
| Open | Masee Jeremy R | $203,200 | |
| Closed | Masee Jeremy R | $50,800 |
Source: Public Records
Tax History
| Year | Tax Paid | Tax Assessment Tax Assessment Total Assessment is a certain percentage of the fair market value that is determined by local assessors to be the total taxable value of land and additions on the property. | Land | Improvement |
|---|---|---|---|---|
| 2025 | $5,526 | $423,800 | $117,100 | $306,700 |
| 2024 | $5,285 | $423,800 | $117,100 | $306,700 |
| 2023 | $4,767 | $260,200 | $82,500 | $177,700 |
| 2022 | $4,741 | $260,200 | $82,500 | $177,700 |
| 2021 | $4,718 | $260,200 | $82,500 | $177,700 |
| 2020 | $4,114 | $257,800 | $82,500 | $175,300 |
| 2019 | $4,519 | $257,800 | $82,500 | $175,300 |
| 2018 | $4,456 | $253,200 | $78,800 | $174,400 |
| 2017 | $2,880 | $253,200 | $78,800 | $174,400 |
| 2016 | $4,127 | $253,200 | $78,800 | $174,400 |
| 2014 | $4,026 | $253,200 | $78,800 | $174,400 |
| 2013 | $4,101 | $255,500 | $78,800 | $176,700 |
Source: Public Records
Map
Nearby Homes
- 153 Eagle Dr
- 27 Murray Dr
- 70 Diamondback Dr
- 88 Eagle Dr
- 46 Blair Dr
- 79 Diamondback Dr
- 73 Diamondback Dr
- 72 Diamondback Dr
- 53 Diamondback Dr
- 88 Big Bear Rd
- 10 York Ct
- 32 Mill St
- 11 Old Ryefield Rd
- 27 Highland St
- 0 Salmon Falls Rd Unit 133
- 121 Long Swamp Rd
- 9A Trestle Rd
- 859 Salmon Falls Rd
- 3 Northland Dr
- 46 Bailey Dr
Your Personal Tour Guide
Ask me questions while you tour the home.