Estimated Value: $460,000 - $488,000
5
Beds
3
Baths
2,588
Sq Ft
$183/Sq Ft
Est. Value
About This Home
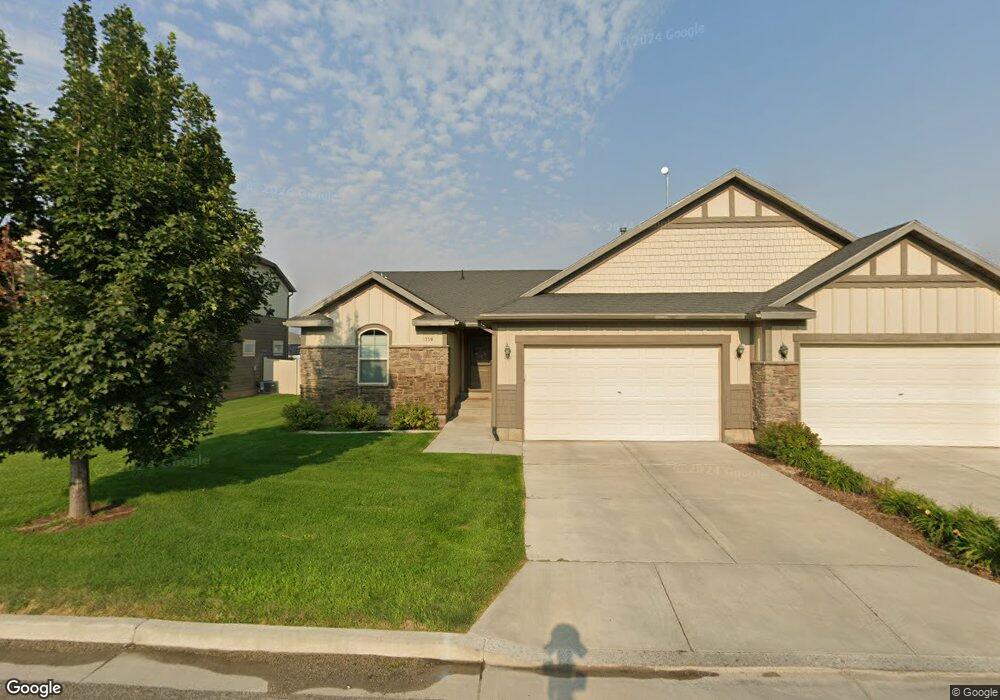
This home is located at 358 S 1250 E, Hyrum, UT 84319 and is currently estimated at $474,844, approximately $183 per square foot. 358 S 1250 E is a home located in Cache County with nearby schools including Canyon School, South Cache Middle School, and Mountain Crest High School.
Ownership History
Date
Name
Owned For
Owner Type
Purchase Details
Closed on
Mar 8, 2021
Sold by
Nielsen Kristen P
Bought by
Weller Nicholas A and Mekker Michelle M
Current Estimated Value
Home Financials for this Owner
Home Financials are based on the most recent Mortgage that was taken out on this home.
Original Mortgage
$337,250
Outstanding Balance
$300,944
Interest Rate
2.7%
Mortgage Type
New Conventional
Estimated Equity
$173,900
Purchase Details
Closed on
Jun 29, 2010
Sold by
Elk Mountain 125 Llc
Bought by
Nielsen Kristen P
Purchase Details
Closed on
Apr 27, 2010
Sold by
Mckay Dev Llc
Bought by
Elk Mountain 125 Llc
Home Financials for this Owner
Home Financials are based on the most recent Mortgage that was taken out on this home.
Original Mortgage
$330,000
Interest Rate
4.94%
Mortgage Type
Purchase Money Mortgage
Create a Home Valuation Report for This Property
The Home Valuation Report is an in-depth analysis detailing your home's value as well as a comparison with similar homes in the area
Home Values in the Area
Average Home Value in this Area
Purchase History
| Date | Buyer | Sale Price | Title Company |
|---|---|---|---|
| Weller Nicholas A | -- | Pinnacle Title | |
| Nielsen Kristen P | -- | Heritage Title | |
| Elk Mountain 125 Llc | -- | Heritage Title |
Source: Public Records
Mortgage History
| Date | Status | Borrower | Loan Amount |
|---|---|---|---|
| Open | Weller Nicholas A | $337,250 | |
| Previous Owner | Elk Mountain 125 Llc | $330,000 |
Source: Public Records
Tax History
| Year | Tax Paid | Tax Assessment Tax Assessment Total Assessment is a certain percentage of the fair market value that is determined by local assessors to be the total taxable value of land and additions on the property. | Land | Improvement |
|---|---|---|---|---|
| 2025 | $1,735 | $452,911 | $95,000 | $357,911 |
| 2024 | $1,684 | $410,476 | $95,000 | $315,476 |
| 2023 | $1,710 | $398,600 | $65,000 | $333,600 |
| 2022 | $1,785 | $398,600 | $65,000 | $333,600 |
| 2021 | $168 | $318,303 | $65,000 | $253,303 |
| 2020 | $1,606 | $285,264 | $65,000 | $220,264 |
| 2019 | $1,528 | $255,264 | $35,000 | $220,264 |
| 2018 | $1,434 | $231,665 | $35,000 | $196,665 |
| 2017 | $1,459 | $122,265 | $0 | $0 |
| 2016 | $1,492 | $97,990 | $0 | $0 |
| 2015 | $1,199 | $97,990 | $0 | $0 |
| 2014 | $1,172 | $97,990 | $0 | $0 |
| 2013 | -- | $98,540 | $0 | $0 |
Source: Public Records
Map
Nearby Homes
Your Personal Tour Guide
Ask me questions while you tour the home.