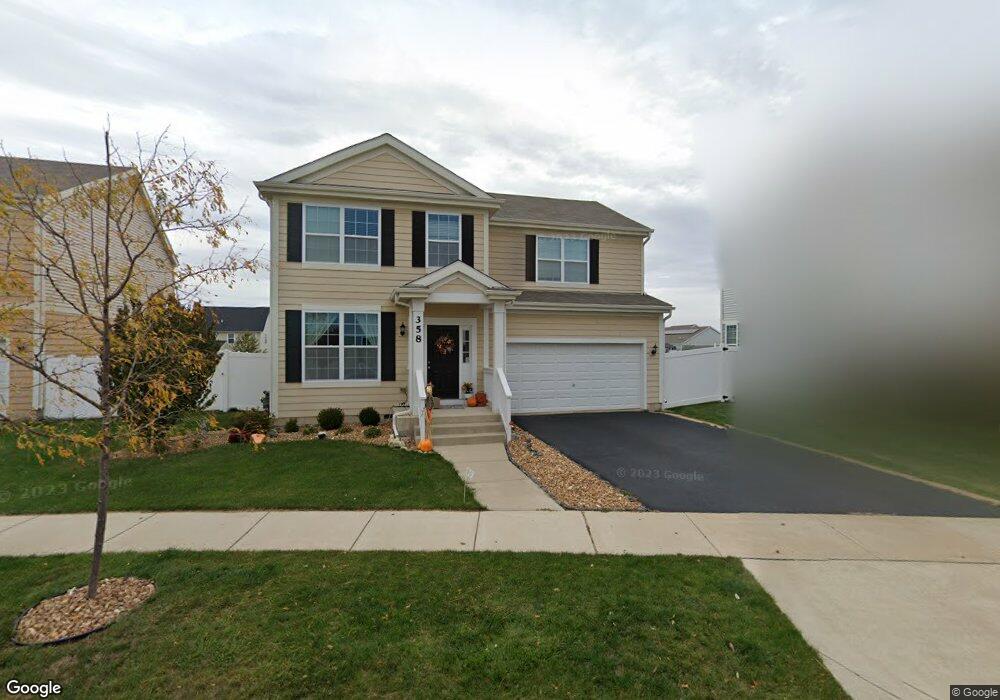
358 Snow Drop Ln Elgin, IL 60124
Far West Elgin NeighborhoodEstimated Value: $412,899 - $437,000
3
Beds
3
Baths
1,872
Sq Ft
$226/Sq Ft
Est. Value
About This Home
This home is located at 358 Snow Drop Ln, Elgin, IL 60124 and is currently estimated at $422,725, approximately $225 per square foot. 358 Snow Drop Ln is a home with nearby schools including Howard B. Thomas Grade School, Prairie Knolls Middle School, and Central Middle School.
Ownership History
Date
Name
Owned For
Owner Type
Purchase Details
Closed on
Oct 11, 2013
Sold by
West Point Gardens Single Family Homes L
Bought by
Vanhiel Tamara L
Current Estimated Value
Home Financials for this Owner
Home Financials are based on the most recent Mortgage that was taken out on this home.
Original Mortgage
$210,044
Outstanding Balance
$158,564
Interest Rate
4.62%
Mortgage Type
FHA
Estimated Equity
$264,161
Purchase Details
Closed on
Sep 16, 2013
Sold by
Koplin West Point Llc
Bought by
West Point Gardens Single Family Homes L
Home Financials for this Owner
Home Financials are based on the most recent Mortgage that was taken out on this home.
Original Mortgage
$210,044
Outstanding Balance
$158,564
Interest Rate
4.62%
Mortgage Type
FHA
Estimated Equity
$264,161
Purchase Details
Closed on
May 21, 2010
Sold by
Nesler Road Limited Partnership
Bought by
Nesler & Lake Lots Llc
Create a Home Valuation Report for This Property
The Home Valuation Report is an in-depth analysis detailing your home's value as well as a comparison with similar homes in the area
Home Values in the Area
Average Home Value in this Area
Purchase History
| Date | Buyer | Sale Price | Title Company |
|---|---|---|---|
| Vanhiel Tamara L | $214,000 | Chicago Title Insurance Comp | |
| West Point Gardens Single Family Homes L | $27,000 | Chicago Title Insurance Comp | |
| Nesler & Lake Lots Llc | -- | Chicago Title Insurance Co |
Source: Public Records
Mortgage History
| Date | Status | Borrower | Loan Amount |
|---|---|---|---|
| Open | Vanhiel Tamara L | $210,044 |
Source: Public Records
Tax History
| Year | Tax Paid | Tax Assessment Tax Assessment Total Assessment is a certain percentage of the fair market value that is determined by local assessors to be the total taxable value of land and additions on the property. | Land | Improvement |
|---|---|---|---|---|
| 2024 | $9,254 | $113,382 | $39,827 | $73,555 |
| 2023 | $8,858 | $102,432 | $35,981 | $66,451 |
| 2022 | $8,373 | $93,400 | $32,808 | $60,592 |
| 2021 | $8,089 | $87,322 | $30,673 | $56,649 |
| 2020 | $7,848 | $83,362 | $29,282 | $54,080 |
| 2019 | $7,532 | $79,408 | $27,893 | $51,515 |
| 2018 | $8,095 | $83,952 | $26,277 | $57,675 |
| 2017 | $7,787 | $79,365 | $24,841 | $54,524 |
| 2016 | $7,751 | $73,630 | $23,046 | $50,584 |
| 2015 | -- | $66,956 | $21,124 | $45,832 |
| 2014 | -- | $60,313 | $20,863 | $39,450 |
| 2013 | -- | $4,444 | $4,444 | $0 |
Source: Public Records
Map
Nearby Homes
- 3770 Westbury Ct
- 250 Water Lily Ln
- 315 Snowdrop Ln
- 264 Snowdrop Ln
- 313 Snowdrop Ln
- 268 Snowdrop Ln
- 282 Snowdrop Ln
- 270 Snowdrop Ln
- 272 Snowdrop Ln
- 280 Snowdrop Ln
- 274 Snowdrop Ln
- 278 Snow Drop Ln
- 284 Snow Drop Ln
- 291 Snowdrop Ln
- 295 Snow Drop Ln
- 3803 Ivy Ln
- 218 Middleton Ct
- 310 Astor Ct
- 283 Snowdrop Ln
- 289 Snowdrop Ln
- 360 Snow Drop Ln
- 356 Snow Drop Ln
- 362 Snow Drop Ln
- 354 Snowdrop Ln
- 354 Snow Drop Ln
- 355 Snowdrop Ln
- 161 Morning Glory Way
- 3775 Gansett Pkwy
- 163 Morning Glory Way
- 3773 Gansett Pkwy
- 333 Snowdrop Ln
- 331 Snowdrop Ln
- 2506 N Randall Rd
- 2500 N Randall Rd Unit 2502
- 3785 Honeysuckle Ln
- 3783 Honeysuckle Ln
- 3782 Honeysuckle Ln
- 3792 Honeysuckle Ln
- 3790 Honeysuckle Ln
- 3786 Honeysuckle Ln
Your Personal Tour Guide
Ask me questions while you tour the home.