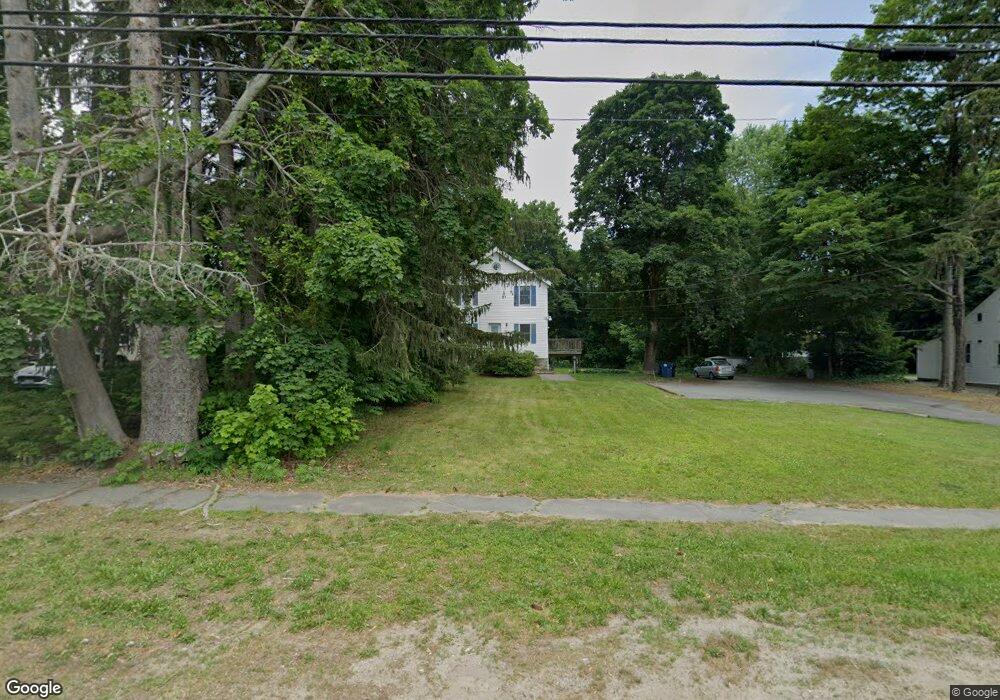
358 Summer St Bridgewater, MA 02324
Estimated Value: $633,661 - $817,000
6
Beds
3
Baths
1,968
Sq Ft
$371/Sq Ft
Est. Value
About This Home
This home is located at 358 Summer St, Bridgewater, MA 02324 and is currently estimated at $730,165, approximately $371 per square foot. 358 Summer St is a home located in Plymouth County with nearby schools including Mitchell Elementary School, Williams Intermediate School, and Bridgewater Middle School.
Ownership History
Date
Name
Owned For
Owner Type
Purchase Details
Closed on
Jul 14, 2003
Sold by
Brogan Jason P and Brehaut Nicole A
Bought by
Brogan Jason P
Current Estimated Value
Home Financials for this Owner
Home Financials are based on the most recent Mortgage that was taken out on this home.
Original Mortgage
$276,000
Outstanding Balance
$119,020
Interest Rate
5.45%
Mortgage Type
Purchase Money Mortgage
Estimated Equity
$611,145
Purchase Details
Closed on
Feb 1, 2001
Sold by
Svizzero Mark D
Bought by
Brogan Jason and Brehaut Nicole
Home Financials for this Owner
Home Financials are based on the most recent Mortgage that was taken out on this home.
Original Mortgage
$237,400
Interest Rate
7.14%
Mortgage Type
Purchase Money Mortgage
Purchase Details
Closed on
Apr 16, 1998
Sold by
Sun William and Sun Linda
Bought by
Svizzero Mark D
Purchase Details
Closed on
Jun 15, 1988
Sold by
Slade Douglas P
Bought by
Sun Family Trust
Create a Home Valuation Report for This Property
The Home Valuation Report is an in-depth analysis detailing your home's value as well as a comparison with similar homes in the area
Home Values in the Area
Average Home Value in this Area
Purchase History
| Date | Buyer | Sale Price | Title Company |
|---|---|---|---|
| Brogan Jason P | $44,000 | -- | |
| Brogan Jason | $249,900 | -- | |
| Svizzero Mark D | $140,000 | -- | |
| Sun Family Trust | $114,000 | -- |
Source: Public Records
Mortgage History
| Date | Status | Borrower | Loan Amount |
|---|---|---|---|
| Open | Sun Family Trust | $276,000 | |
| Previous Owner | Sun Family Trust | $237,400 |
Source: Public Records
Tax History Compared to Growth
Tax History
| Year | Tax Paid | Tax Assessment Tax Assessment Total Assessment is a certain percentage of the fair market value that is determined by local assessors to be the total taxable value of land and additions on the property. | Land | Improvement |
|---|---|---|---|---|
| 2025 | $6,647 | $561,900 | $187,200 | $374,700 |
| 2024 | $6,170 | $508,200 | $178,300 | $329,900 |
| 2023 | $5,809 | $452,400 | $166,600 | $285,800 |
| 2022 | $5,084 | $355,000 | $146,200 | $208,800 |
| 2021 | $4,641 | $320,500 | $130,500 | $190,000 |
| 2020 | $4,590 | $311,600 | $125,500 | $186,100 |
| 2019 | $4,330 | $292,000 | $125,500 | $166,500 |
| 2018 | $4,170 | $274,500 | $121,900 | $152,600 |
| 2017 | $4,105 | $263,000 | $121,900 | $141,100 |
| 2016 | $3,977 | $255,900 | $119,500 | $136,400 |
| 2015 | $4,011 | $247,000 | $116,000 | $131,000 |
| 2014 | $3,931 | $241,900 | $112,600 | $129,300 |
Source: Public Records
Map
Nearby Homes
- 29 Leonard St Unit 29
- 35 Leonard St Unit 35
- 220 Bedford St Unit D-5
- 130 Maple Ave
- 317 Water St
- 167 Spring St
- 16 Cassidy Place Unit 16
- 2 Fontana Way
- Lot 3 Fontana Way
- 55 Edge Hill Dr
- 45 Edge Hill Dr Unit 47
- 398 Plymouth St
- 74 Mount Prospect St
- 128 Broad St
- 12 Perkins St
- 48 Pearl St
- Lot 1 Hammond St
- 180 Main St Unit C55
- 180 Main St Unit 6-203
- 0 Flagg St Unit 73421818