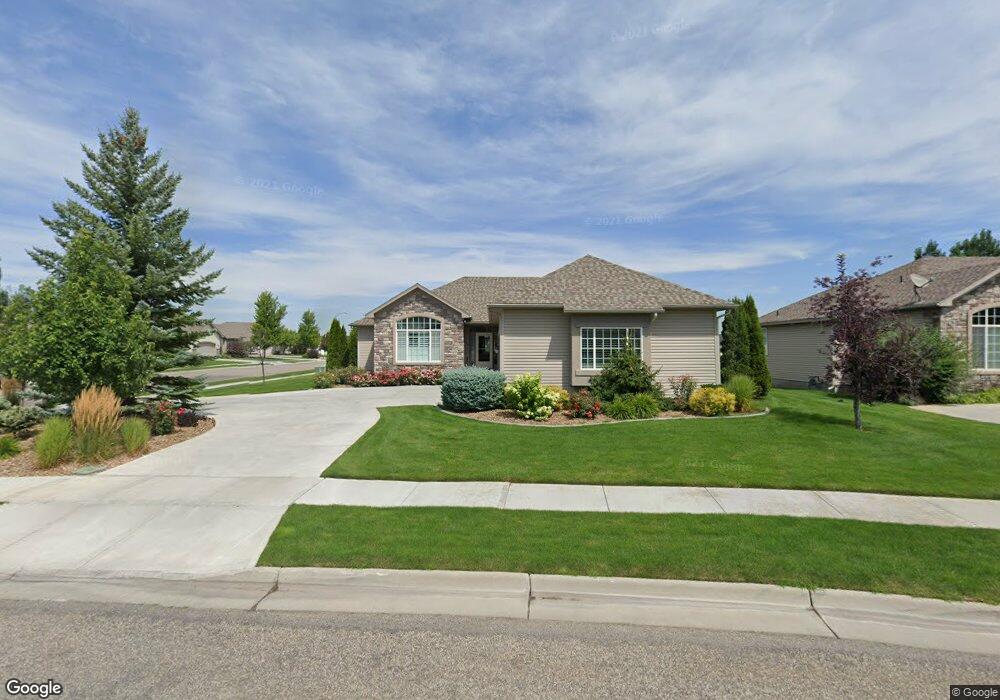
358 Tapitio Dr Idaho Falls, ID 83401
Estimated Value: $512,000 - $569,441
4
Beds
3
Baths
3,650
Sq Ft
$151/Sq Ft
Est. Value
About This Home
This home is located at 358 Tapitio Dr, Idaho Falls, ID 83401 and is currently estimated at $550,360, approximately $150 per square foot. 358 Tapitio Dr is a home located in Bonneville County with nearby schools including Temple View Elementary School, Eagle Rock Middle School, and Skyline Senior High School.
Ownership History
Date
Name
Owned For
Owner Type
Purchase Details
Closed on
Aug 21, 2024
Sold by
Lee Max K
Bought by
Lee Nolan C
Current Estimated Value
Home Financials for this Owner
Home Financials are based on the most recent Mortgage that was taken out on this home.
Original Mortgage
$150,000
Interest Rate
6.77%
Mortgage Type
Construction
Purchase Details
Closed on
Aug 27, 2009
Sold by
Kelley Rick and Kelley Deanna
Bought by
Lee Max
Purchase Details
Closed on
Feb 22, 2006
Sold by
Jones Blake
Bought by
Kelley Rick and Kelley Deanna
Home Financials for this Owner
Home Financials are based on the most recent Mortgage that was taken out on this home.
Original Mortgage
$220,693
Interest Rate
6.08%
Mortgage Type
New Conventional
Purchase Details
Closed on
Oct 27, 2005
Sold by
Cambridge Development Inc
Bought by
Blake Jones Construction
Create a Home Valuation Report for This Property
The Home Valuation Report is an in-depth analysis detailing your home's value as well as a comparison with similar homes in the area
Home Values in the Area
Average Home Value in this Area
Purchase History
| Date | Buyer | Sale Price | Title Company |
|---|---|---|---|
| Lee Nolan C | -- | Alliance Title | |
| Lee Max | -- | -- | |
| Kelley Rick | -- | First American Title Co | |
| Blake Jones Construction | -- | -- |
Source: Public Records
Mortgage History
| Date | Status | Borrower | Loan Amount |
|---|---|---|---|
| Previous Owner | Lee Nolan C | $150,000 | |
| Previous Owner | Kelley Rick | $220,693 |
Source: Public Records
Tax History Compared to Growth
Tax History
| Year | Tax Paid | Tax Assessment Tax Assessment Total Assessment is a certain percentage of the fair market value that is determined by local assessors to be the total taxable value of land and additions on the property. | Land | Improvement |
|---|---|---|---|---|
| 2025 | $3,396 | $607,690 | $84,065 | $523,625 |
| 2024 | $3,396 | $598,670 | $67,360 | $531,310 |
| 2023 | $3,083 | $536,145 | $74,015 | $462,130 |
| 2022 | $4,415 | $478,510 | $58,860 | $419,650 |
| 2021 | $3,329 | $336,579 | $51,209 | $285,370 |
| 2019 | $3,670 | $307,107 | $43,767 | $263,340 |
| 2018 | $3,403 | $306,752 | $36,672 | $270,080 |
| 2017 | $3,247 | $281,952 | $36,672 | $245,280 |
| 2016 | $3,011 | $275,492 | $36,672 | $238,820 |
| 2015 | $1,514 | $252,592 | $36,672 | $215,920 |
| 2014 | $56,880 | $252,592 | $36,672 | $215,920 |
| 2013 | $3,176 | $257,691 | $36,671 | $221,020 |
Source: Public Records
Map
Nearby Homes
- 408 Tapitio Dr
- 6111 Bay Hill Dr
- 299 Lacosta Dr
- 5700 Gleneagles Dr
- 5640 Gleneagles Dr
- 6349 Ender Ln
- 6395 Ender Ln
- 6409 Ender Ln
- 6425 Ender Ln
- 6439 Ender Ln
- 6455 Ender Ln
- 6469 Ender Ln
- L15&16B4 Ender Ln
- 6394 Ender Ln
- 6410 Ender Ln
- 275 Birdie Thompson Dr
- 5513 Rock Hollow Ln
- L19&20B4 Achilles Ave
- L24&25B5 Achilles Ave
- L22&23B5 Achilles Ave