Estimated Value: $299,000 - $329,000
2
Beds
1
Bath
1,125
Sq Ft
$281/Sq Ft
Est. Value
About This Home
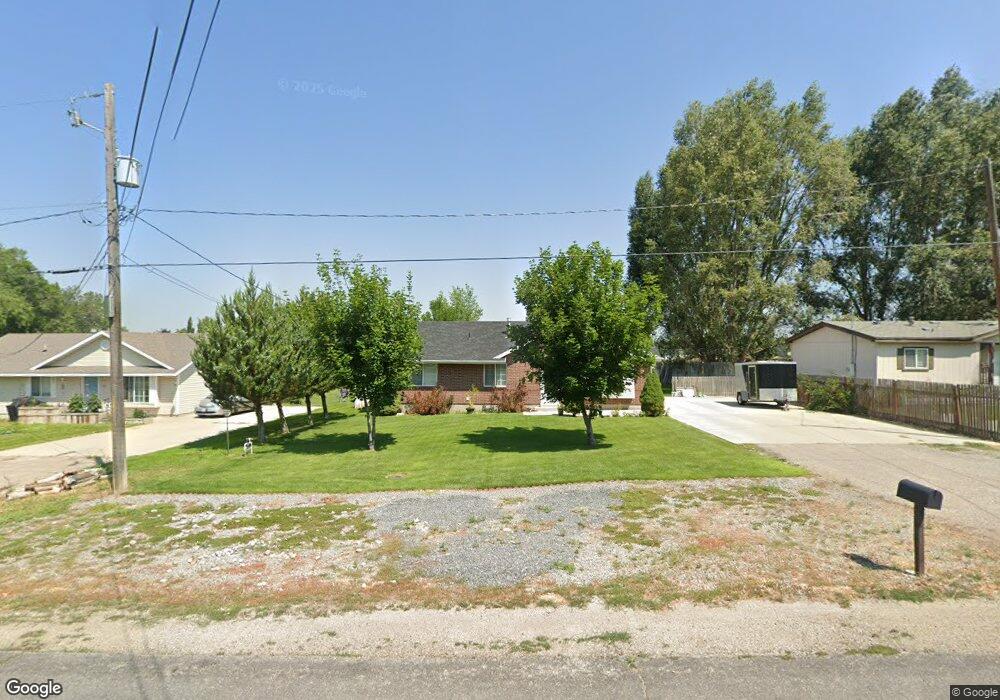
This home is located at 358 W 200 S, Hyrum, UT 84319 and is currently estimated at $315,596, approximately $280 per square foot. 358 W 200 S is a home located in Cache County with nearby schools including Lincoln School, South Cache Middle School, and Mountain Crest High School.
Ownership History
Date
Name
Owned For
Owner Type
Purchase Details
Closed on
Feb 12, 2010
Sold by
Federal National Mortgage Association
Bought by
Molina Adriana
Current Estimated Value
Home Financials for this Owner
Home Financials are based on the most recent Mortgage that was taken out on this home.
Original Mortgage
$112,131
Outstanding Balance
$75,647
Interest Rate
5.5%
Mortgage Type
FHA
Estimated Equity
$239,949
Purchase Details
Closed on
Sep 21, 2009
Sold by
Wilson Tony and Wilson Leila
Bought by
Federal National Mortgage Association
Purchase Details
Closed on
Mar 31, 2008
Sold by
Hugie Cody J and Hugie Cynthia C
Bought by
Wilson Tony and Wilson Leila
Home Financials for this Owner
Home Financials are based on the most recent Mortgage that was taken out on this home.
Original Mortgage
$128,000
Interest Rate
6.04%
Mortgage Type
New Conventional
Create a Home Valuation Report for This Property
The Home Valuation Report is an in-depth analysis detailing your home's value as well as a comparison with similar homes in the area
Home Values in the Area
Average Home Value in this Area
Purchase History
| Date | Buyer | Sale Price | Title Company |
|---|---|---|---|
| Molina Adriana | $114,200 | Us Title | |
| Federal National Mortgage Association | $142,003 | Backman Title Services | |
| Wilson Tony | -- | Northern Title Company |
Source: Public Records
Mortgage History
| Date | Status | Borrower | Loan Amount |
|---|---|---|---|
| Open | Molina Adriana | $112,131 | |
| Previous Owner | Wilson Tony | $128,000 |
Source: Public Records
Tax History Compared to Growth
Tax History
| Year | Tax Paid | Tax Assessment Tax Assessment Total Assessment is a certain percentage of the fair market value that is determined by local assessors to be the total taxable value of land and additions on the property. | Land | Improvement |
|---|---|---|---|---|
| 2025 | $1,105 | $158,640 | $0 | $0 |
| 2024 | $1,179 | $158,050 | $0 | $0 |
| 2023 | $1,008 | $129,190 | $0 | $0 |
| 2022 | $1,052 | $129,190 | $0 | $0 |
| 2021 | $1,061 | $200,920 | $65,050 | $135,870 |
| 2020 | $1,010 | $179,406 | $65,050 | $114,356 |
| 2019 | $924 | $154,356 | $40,000 | $114,356 |
| 2018 | $863 | $139,440 | $40,000 | $99,440 |
| 2017 | $856 | $71,720 | $0 | $0 |
| 2016 | $875 | $71,720 | $0 | $0 |
| 2015 | $810 | $66,255 | $0 | $0 |
| 2014 | $792 | $66,255 | $0 | $0 |
| 2013 | -- | $66,255 | $0 | $0 |
Source: Public Records
Map
Nearby Homes