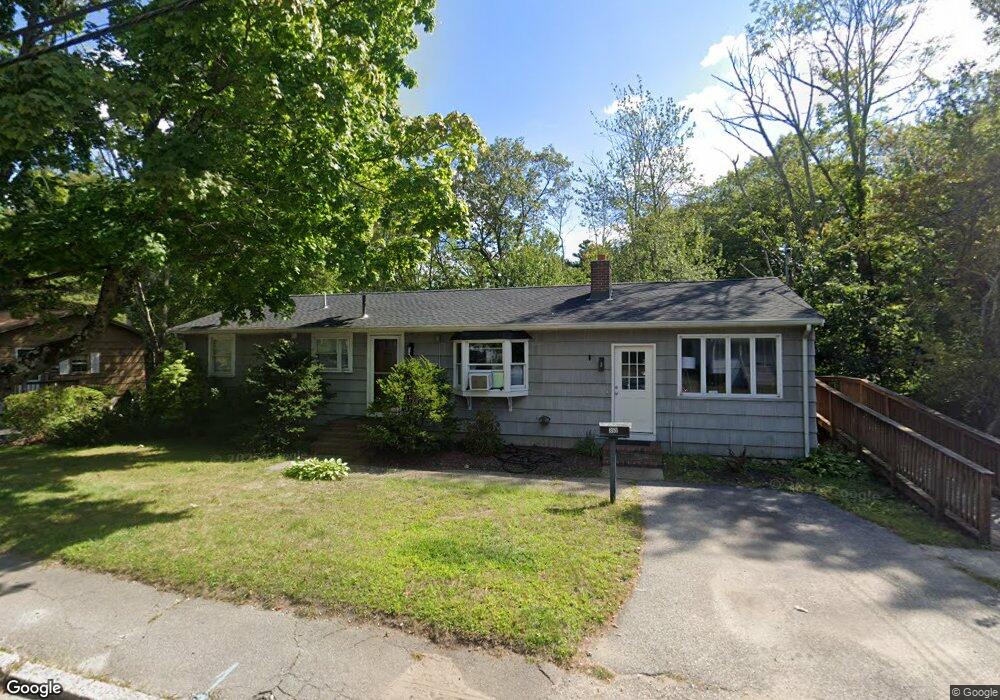
358 West St Weymouth, MA 02188
South Weymouth NeighborhoodEstimated Value: $530,938 - $997,000
3
Beds
4
Baths
1,400
Sq Ft
$470/Sq Ft
Est. Value
About This Home
This home is located at 358 West St, Weymouth, MA 02188 and is currently estimated at $657,485, approximately $469 per square foot. 358 West St is a home located in Norfolk County with nearby schools including Thomas V Nash, Abigail Adams Middle School, and Weymouth Middle School Chapman.
Ownership History
Date
Name
Owned For
Owner Type
Purchase Details
Closed on
May 21, 2021
Sold by
Tamborella Nancy M and Sullivan Sandra A
Bought by
Tamborella Angela M and Leach Joshua R
Current Estimated Value
Home Financials for this Owner
Home Financials are based on the most recent Mortgage that was taken out on this home.
Original Mortgage
$294,500
Outstanding Balance
$266,891
Interest Rate
3.1%
Mortgage Type
Purchase Money Mortgage
Estimated Equity
$390,594
Create a Home Valuation Report for This Property
The Home Valuation Report is an in-depth analysis detailing your home's value as well as a comparison with similar homes in the area
Home Values in the Area
Average Home Value in this Area
Purchase History
| Date | Buyer | Sale Price | Title Company |
|---|---|---|---|
| Tamborella Angela M | $310,000 | None Available |
Source: Public Records
Mortgage History
| Date | Status | Borrower | Loan Amount |
|---|---|---|---|
| Open | Tamborella Angela M | $294,500 |
Source: Public Records
Tax History Compared to Growth
Tax History
| Year | Tax Paid | Tax Assessment Tax Assessment Total Assessment is a certain percentage of the fair market value that is determined by local assessors to be the total taxable value of land and additions on the property. | Land | Improvement |
|---|---|---|---|---|
| 2025 | $4,882 | $483,400 | $164,200 | $319,200 |
| 2024 | $4,730 | $460,600 | $156,400 | $304,200 |
| 2023 | $4,561 | $436,500 | $144,800 | $291,700 |
| 2022 | $4,425 | $386,100 | $134,100 | $252,000 |
| 2021 | $4,345 | $370,100 | $134,100 | $236,000 |
| 2020 | $4,227 | $354,600 | $134,100 | $220,500 |
| 2019 | $4,038 | $333,200 | $128,900 | $204,300 |
| 2018 | $3,904 | $312,300 | $122,800 | $189,500 |
| 2017 | $3,621 | $282,700 | $117,000 | $165,700 |
| 2016 | $3,482 | $272,000 | $112,500 | $159,500 |
| 2015 | $3,326 | $257,800 | $112,500 | $145,300 |
| 2014 | $3,260 | $245,100 | $104,700 | $140,400 |
Source: Public Records
Map
Nearby Homes
- 655 Summer St
- 262 West St
- 255 West St
- 92 Mercury St
- 441 Grove St
- 432 Grove St
- 308 Forest St
- 501 Commerce Dr Unit 2310
- 501 Commerce Dr Unit 1111
- 501 Commerce Dr Unit 4206
- 501 Commerce Dr Unit 4308
- 501 Commerce Dr Unit 4306
- 16 Jay Rd
- 24 Fisher Rd
- 116 Belmont St
- 972 Liberty St
- 68 Massapoag St Unit 7
- 354 Tilden Commons Ln
- 2 Mitchell Ln Unit B
- 200 Justin Dr Unit 3
- 350 West St
- 359 West St
- 342 West St
- 353 West St
- 600 Grove St Unit 1st fl
- 600 Grove St
- 600 Grove St Unit bsmt
- 600 Grove St Unit 1st Floor
- 336 West St
- 336 West St Unit 336
- 336 West St Unit 1
- 337 West St
- 328 West St
- 327 West St
- 45 Blueberry Place
- 316 West St
- 35 Blueberry Place
- 315 West St
- 707 Summer St
- 4 Blueberry Place