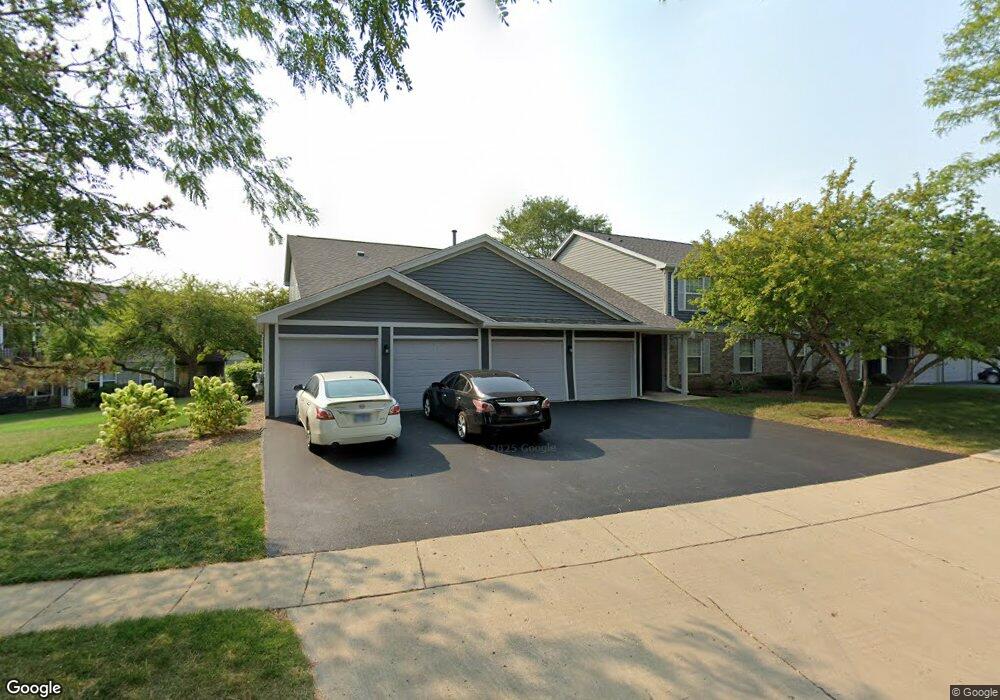
358 Woodview Cir Unit 14B21 Elgin, IL 60120
Bluff City NeighborhoodEstimated Value: $191,991 - $233,000
2
Beds
--
Bath
1,125
Sq Ft
$196/Sq Ft
Est. Value
About This Home
This home is located at 358 Woodview Cir Unit 14B21, Elgin, IL 60120 and is currently estimated at $220,498, approximately $195 per square foot. 358 Woodview Cir Unit 14B21 is a home located in Cook County with nearby schools including Hilltop Elementary School, Ellis Middle School, and Elgin High School.
Ownership History
Date
Name
Owned For
Owner Type
Purchase Details
Closed on
Apr 28, 2000
Sold by
English Stephanie N and Tyus Christine
Bought by
Trotter Naomi
Current Estimated Value
Home Financials for this Owner
Home Financials are based on the most recent Mortgage that was taken out on this home.
Original Mortgage
$98,600
Interest Rate
8.12%
Mortgage Type
FHA
Purchase Details
Closed on
Oct 22, 1999
Sold by
Gillan Shelly D
Bought by
English Stephanie N and Tyus Christine
Home Financials for this Owner
Home Financials are based on the most recent Mortgage that was taken out on this home.
Original Mortgage
$92,250
Interest Rate
7.87%
Mortgage Type
FHA
Purchase Details
Closed on
Apr 8, 1994
Sold by
Parkway Bank & Trust Company
Bought by
Gillan Shelly D
Home Financials for this Owner
Home Financials are based on the most recent Mortgage that was taken out on this home.
Original Mortgage
$68,800
Interest Rate
8.5%
Create a Home Valuation Report for This Property
The Home Valuation Report is an in-depth analysis detailing your home's value as well as a comparison with similar homes in the area
Home Values in the Area
Average Home Value in this Area
Purchase History
| Date | Buyer | Sale Price | Title Company |
|---|---|---|---|
| Trotter Naomi | $101,000 | Chicago Title Insurance Co | |
| English Stephanie N | $94,500 | -- | |
| Gillan Shelly D | $86,500 | Land Title Company |
Source: Public Records
Mortgage History
| Date | Status | Borrower | Loan Amount |
|---|---|---|---|
| Previous Owner | Trotter Naomi | $98,600 | |
| Previous Owner | English Stephanie N | $92,250 | |
| Previous Owner | Gillan Shelly D | $68,800 |
Source: Public Records
Tax History
| Year | Tax Paid | Tax Assessment Tax Assessment Total Assessment is a certain percentage of the fair market value that is determined by local assessors to be the total taxable value of land and additions on the property. | Land | Improvement |
|---|---|---|---|---|
| 2025 | $1,031 | $19,555 | $2,171 | $17,384 |
| 2024 | $1,031 | $14,006 | $2,016 | $11,990 |
| 2023 | $1,034 | $14,006 | $2,016 | $11,990 |
| 2022 | $1,034 | $14,006 | $2,016 | $11,990 |
| 2021 | $1,240 | $9,592 | $1,628 | $7,964 |
| 2020 | $1,372 | $9,592 | $1,628 | $7,964 |
| 2019 | $2,251 | $10,772 | $1,628 | $9,144 |
| 2018 | $1,455 | $7,718 | $1,395 | $6,323 |
| 2017 | $1,471 | $7,718 | $1,395 | $6,323 |
| 2016 | $1,664 | $7,718 | $1,395 | $6,323 |
| 2015 | $1,518 | $6,944 | $1,240 | $5,704 |
| 2014 | $1,489 | $6,944 | $1,240 | $5,704 |
| 2013 | $1,420 | $6,944 | $1,240 | $5,704 |
Source: Public Records
Map
Nearby Homes
- 330 Buckingham Cir Unit C
- 385 Woodview Cir Unit B
- 445 Lucile Ave
- 1182 Concord Dr
- 149 Highbury Dr
- 130 Stonehurst Dr
- 513 Cookane Ave
- 689 Bent St
- 833 Forest Ave
- 1160 Case Ln
- 631 Bent St
- 335 Shiloh Ln
- 457 Arlington Ave
- 1154 Pegwood Dr
- 450 Villa St
- 899 Carl Ave
- 1103 Nottingham Ln
- 1440 Eliot Trail
- 483 Barrett St
- 332-334 St Charles St
- 358 Woodview Cir Unit 14A21
- 358 Woodview Cir Unit 14A11
- 358 Woodview Cir Unit 14B11
- 358 Woodview Cir Unit B
- 358 Woodview Cir Unit A
- 358 Woodview Cir Unit A
- 356 Woodview Cir Unit 14B22
- 356 Woodview Cir Unit 14A22
- 356 Woodview Cir Unit 14A12
- 356 Woodview Cir Unit 14B12
- 356 Woodview Cir Unit C
- 356 Woodview Cir Unit D
- 1025 Berkshire Ct Unit 37B21
- 1025 Berkshire Ct Unit 37A21
- 1025 Berkshire Ct Unit 37A11
- 1025 Berkshire Ct Unit 37B11
- 1025 Berkshire Ct Unit D
- 1025 Berkshire Ct Unit C
- 1023 Berkshire Ct Unit 37A12
- 1023 Berkshire Ct Unit 37B22
Your Personal Tour Guide
Ask me questions while you tour the home.