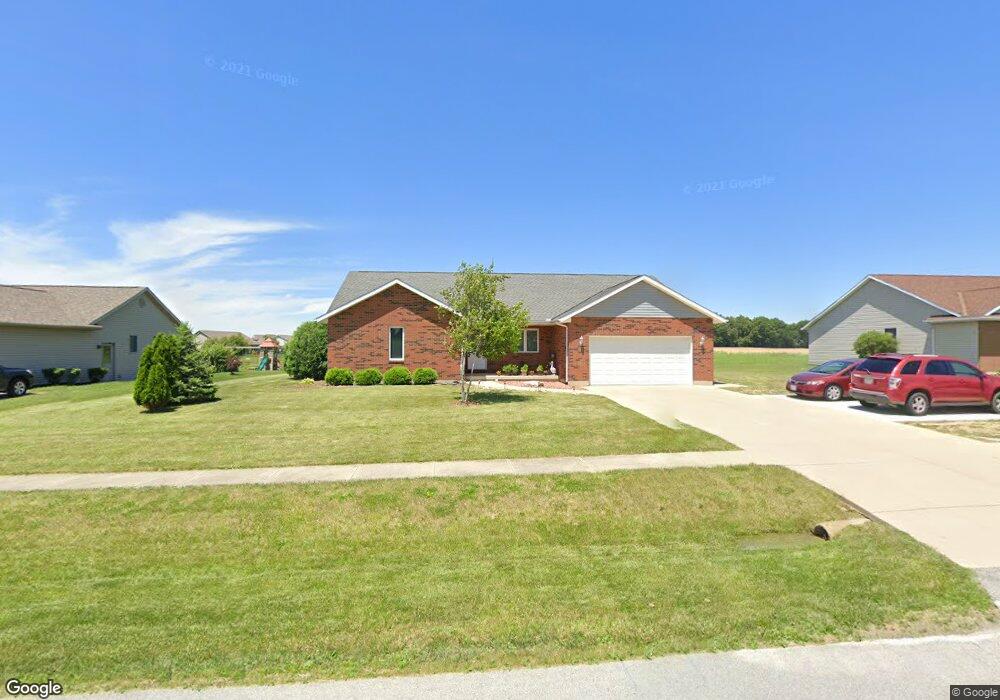
358 Wuebker Rd Minster, OH 45865
Estimated Value: $310,000 - $338,137
3
Beds
3
Baths
1,820
Sq Ft
$178/Sq Ft
Est. Value
About This Home
This home is located at 358 Wuebker Rd, Minster, OH 45865 and is currently estimated at $324,284, approximately $178 per square foot. 358 Wuebker Rd is a home located in Auglaize County with nearby schools including Minster Elementary School and Minster Junior/Senior High School.
Ownership History
Date
Name
Owned For
Owner Type
Purchase Details
Closed on
Aug 31, 2007
Sold by
Ziegenbusch Barbara
Bought by
Davis Charles C and Davis Lori L
Current Estimated Value
Home Financials for this Owner
Home Financials are based on the most recent Mortgage that was taken out on this home.
Original Mortgage
$160,000
Outstanding Balance
$102,437
Interest Rate
6.79%
Mortgage Type
Purchase Money Mortgage
Estimated Equity
$221,847
Purchase Details
Closed on
Mar 14, 2006
Sold by
Howell Drew A and Howell Shannon F
Bought by
Ziegenbusch Lowell and Ziegenbusch Barbara
Home Financials for this Owner
Home Financials are based on the most recent Mortgage that was taken out on this home.
Original Mortgage
$194,000
Interest Rate
6.33%
Mortgage Type
Purchase Money Mortgage
Purchase Details
Closed on
Sep 15, 2003
Sold by
Niekamp Harold W and Niekamp Nancy L
Bought by
Cantrell Keith D
Create a Home Valuation Report for This Property
The Home Valuation Report is an in-depth analysis detailing your home's value as well as a comparison with similar homes in the area
Home Values in the Area
Average Home Value in this Area
Purchase History
| Date | Buyer | Sale Price | Title Company |
|---|---|---|---|
| Davis Charles C | $188,500 | Attorney | |
| Ziegenbusch Lowell | $64,966 | None Available | |
| Cantrell Keith D | $27,000 | -- |
Source: Public Records
Mortgage History
| Date | Status | Borrower | Loan Amount |
|---|---|---|---|
| Open | Davis Charles C | $160,000 | |
| Closed | Ziegenbusch Lowell | $194,000 |
Source: Public Records
Tax History Compared to Growth
Tax History
| Year | Tax Paid | Tax Assessment Tax Assessment Total Assessment is a certain percentage of the fair market value that is determined by local assessors to be the total taxable value of land and additions on the property. | Land | Improvement |
|---|---|---|---|---|
| 2024 | $6,391 | $92,130 | $18,220 | $73,910 |
| 2023 | $3,038 | $92,130 | $18,220 | $73,910 |
| 2022 | $2,770 | $77,960 | $16,570 | $61,390 |
| 2021 | $2,833 | $77,960 | $16,570 | $61,390 |
| 2020 | $1,456 | $77,953 | $16,566 | $61,387 |
| 2019 | $2,675 | $67,414 | $14,280 | $53,134 |
| 2018 | $2,659 | $67,414 | $14,280 | $53,134 |
| 2017 | $2,661 | $67,414 | $14,280 | $53,134 |
| 2016 | $2,345 | $57,733 | $13,601 | $44,132 |
| 2015 | $2,307 | $57,733 | $13,601 | $44,132 |
| 2014 | $2,248 | $57,733 | $13,601 | $44,132 |
| 2013 | $2,355 | $57,733 | $13,601 | $44,132 |
Source: Public Records
Map
Nearby Homes
- 561 S Walnut St Unit Lot3
- 36 Shania Place Unit 23
- 27 Shania Place Unit 26
- 19 Shania Place Unit 33
- 28 Shania Place Unit 33
- 11 Shania Place Unit 28
- 17 Stonegate Dr
- 0 Stonegate Dr Unit 21 10544857
- 0 Stonegate Dr Unit 14 10544847
- 129 Janice Dr
- 130 Janice Dr
- 133 Janice Dr
- 137 Janice Dr
- 132 Janice Dr
- 141 Janice Dr
- 136 Janice Dr
- 193 N Paris St
- 145 Janice Dr
- 140 Janice Dr
- 149 Janice Dr
- 362 Wuebker Rd
- 354 Wuebker Rd
- 366 Wuebker Rd
- 350 Wuebker Rd
- 26 Kimberly Ct
- 0 Wuebker Rd Unit Lot 1 324519
- 0 Wuebker Rd
- 22 Kimberly Ct
- 17 Kimberly Ct
- 18 Kimberly Ct
- 9 Kimberly Ct
- 14 Kimberly Ct
- 13 Kimberly Ct
- 9 Kimberly Ct
- 5 Kimberly Ct
- 10 Kimberly Ct
- 6 Kimberly Ct
- 305 Wuebker Rd
- 1008 S Walnut St
- 359 Wuebker Rd