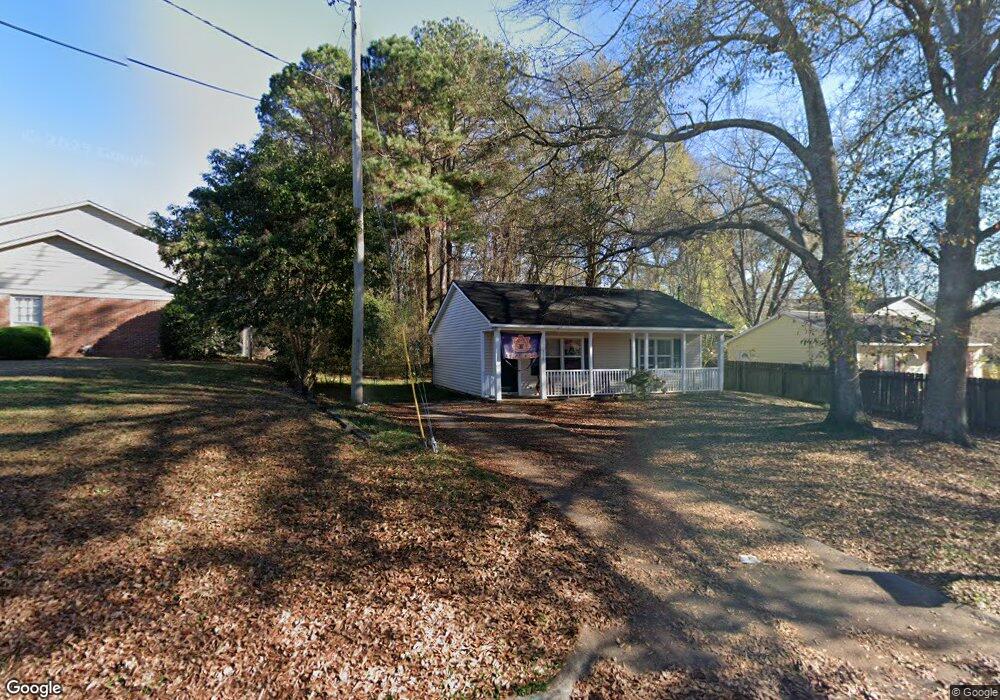
358 Youngs Mill Rd Lagrange, GA 30241
Estimated Value: $82,875 - $192,000
2
Beds
1
Bath
768
Sq Ft
$172/Sq Ft
Est. Value
About This Home
This home is located at 358 Youngs Mill Rd, Lagrange, GA 30241 and is currently estimated at $132,219, approximately $172 per square foot. 358 Youngs Mill Rd is a home located in Troup County with nearby schools including Callaway Elementary School, Hogansville Elementary School, and Callaway Middle School.
Ownership History
Date
Name
Owned For
Owner Type
Purchase Details
Closed on
May 1, 1998
Sold by
Higgins Amber
Bought by
Higgins Kenneth and Higgins Amber G
Current Estimated Value
Purchase Details
Closed on
Apr 30, 1998
Sold by
Sedretary Of Hud
Bought by
Higgins Amber
Purchase Details
Closed on
Mar 16, 1998
Sold by
Southtrust Mortg
Bought by
Sedretary Of Hud
Purchase Details
Closed on
Jan 6, 1998
Sold by
American General
Bought by
Southtrust Mortg
Purchase Details
Closed on
Oct 7, 1997
Sold by
Russell Todd Creel
Bought by
American General
Purchase Details
Closed on
Dec 26, 1991
Sold by
Dan-Ric Inc
Bought by
Russell Todd Creel
Purchase Details
Closed on
Oct 3, 1991
Sold by
First Federal Savings Bank
Bought by
Dan-Ric Inc
Purchase Details
Closed on
Sep 10, 1990
Sold by
First Federal Savings Bank
Bought by
First Federal Savings Bank
Purchase Details
Closed on
Jun 6, 1978
Sold by
Beclin Company
Bought by
First Federal Savings Bank
Create a Home Valuation Report for This Property
The Home Valuation Report is an in-depth analysis detailing your home's value as well as a comparison with similar homes in the area
Home Values in the Area
Average Home Value in this Area
Purchase History
| Date | Buyer | Sale Price | Title Company |
|---|---|---|---|
| Higgins Kenneth | -- | -- | |
| Higgins Amber | $47,100 | -- | |
| Sedretary Of Hud | $46,500 | -- | |
| Southtrust Mortg | $46,500 | -- | |
| American General | $5,100 | -- | |
| Russell Todd Creel | $43,000 | -- | |
| Dan-Ric Inc | -- | -- | |
| First Federal Savings Bank | -- | -- | |
| First Federal Savings Bank | $12,000 | -- |
Source: Public Records
Tax History Compared to Growth
Tax History
| Year | Tax Paid | Tax Assessment Tax Assessment Total Assessment is a certain percentage of the fair market value that is determined by local assessors to be the total taxable value of land and additions on the property. | Land | Improvement |
|---|---|---|---|---|
| 2024 | $1,045 | $38,320 | $8,000 | $30,320 |
| 2023 | $215 | $27,760 | $5,320 | $22,440 |
| 2022 | $677 | $26,240 | $5,320 | $20,920 |
| 2021 | $601 | $21,920 | $5,320 | $16,600 |
| 2020 | $601 | $21,920 | $5,320 | $16,600 |
| 2019 | $524 | $19,360 | $4,200 | $15,160 |
| 2018 | $524 | $19,360 | $4,200 | $15,160 |
| 2017 | $524 | $19,360 | $4,200 | $15,160 |
| 2016 | $517 | $19,114 | $4,200 | $14,914 |
| 2015 | $552 | $20,246 | $5,332 | $14,914 |
| 2014 | $510 | $18,830 | $5,084 | $13,746 |
| 2013 | -- | $19,938 | $5,084 | $14,854 |
Source: Public Records
Map
Nearby Homes
- 105 Lenox Cir
- 101 Lenox Cir
- 305 Lenox Cir
- 121 Ct
- 0 N Barnard Ave
- 130 Clara Jean Ct
- 509 Youngs Mill Rd
- 227 River Meadow Dr Unit H14
- 231 River Meadow Dr
- 412 Sweetwood Ct Unit A36
- 207 Baileys Way
- 793 Celebration Blvd
- 105 Ridgefield Dr
- 113 Woodridge Cir
- 112 Celebration Blvd
- 117 Celebration Blvd
- 121 Woodridge Cir
- 125 Ridgefield Cir
- 129 Celebration Blvd
- 456 Brookstone Dr
- 348 Youngs Mill Rd
- 103 Peachtree Ct
- 101 Peachtree Ct
- 105 Peachtree Ct
- 104108 Peachtree Ct
- 107 Peachtree Ct
- 100 Peachtree Ct
- 339 Youngs Mill Rd
- 384 Youngs Mill Rd
- 102 Peachtree Ct
- 102 Peachtree Ct Unit A/B
- 102 Peachtree Ct Unit A
- 104 Peachtree Ct Unit A
- 104 Peachtree Ct
- 108 Peachtree Ct Unit B
- 108 Peachtree Ct Unit A
- 108 Peachtree Ct Unit A
- 108 Peachtree Ct Unit C
- 215 N Barnard Ave
- 241 N Barnard Ave