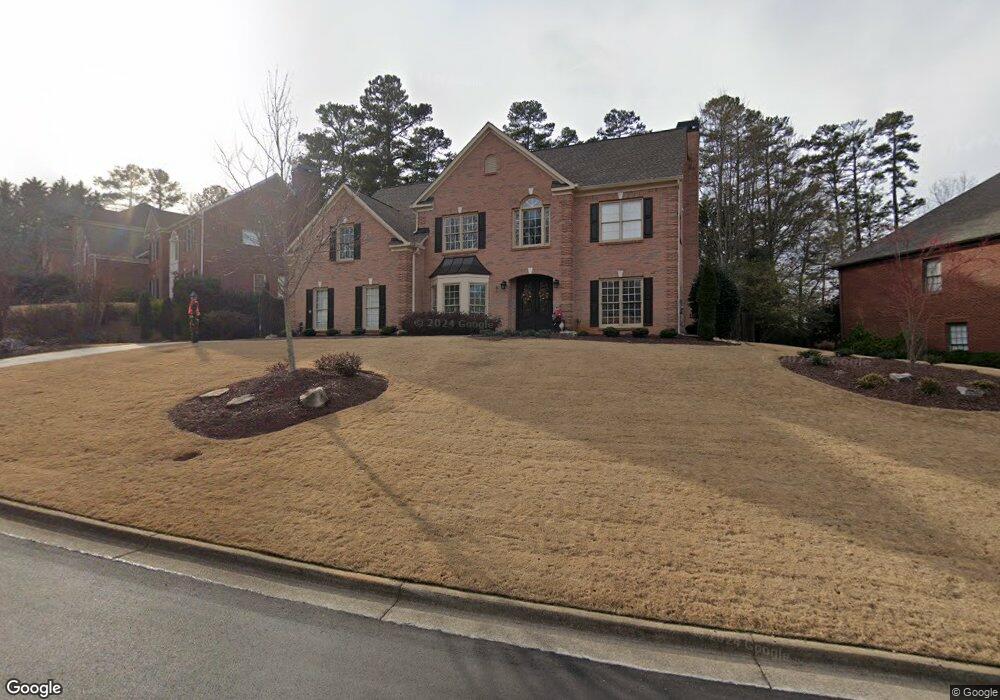
3580 Hickory Branch Trail Unit 1 Suwanee, GA 30024
Estimated Value: $661,018 - $863,000
5
Beds
4
Baths
3,460
Sq Ft
$214/Sq Ft
Est. Value
About This Home
This home is located at 3580 Hickory Branch Trail Unit 1, Suwanee, GA 30024 and is currently estimated at $741,755, approximately $214 per square foot. 3580 Hickory Branch Trail Unit 1 is a home located in Gwinnett County with nearby schools including Suwanee Elementary School, North Gwinnett Middle School, and North Gwinnett High School.
Ownership History
Date
Name
Owned For
Owner Type
Purchase Details
Closed on
Feb 16, 2012
Sold by
Chapman Derek P
Bought by
Alia Samuel M and Alia Deborah
Current Estimated Value
Purchase Details
Closed on
Nov 20, 2009
Sold by
Oliveaux David and Oliveaux Sandra
Bought by
Chapman Derek P and Chapman Rebecca C
Home Financials for this Owner
Home Financials are based on the most recent Mortgage that was taken out on this home.
Original Mortgage
$244,000
Interest Rate
5.01%
Mortgage Type
New Conventional
Purchase Details
Closed on
Oct 7, 2003
Sold by
Moss Charles A and Moss Debra C
Bought by
Oliveaux David and Oliveaux Sandra
Home Financials for this Owner
Home Financials are based on the most recent Mortgage that was taken out on this home.
Original Mortgage
$240,000
Interest Rate
6.45%
Mortgage Type
New Conventional
Purchase Details
Closed on
Apr 30, 1998
Sold by
The Ryland Group
Bought by
Moss Charles A and Moss Debra C
Home Financials for this Owner
Home Financials are based on the most recent Mortgage that was taken out on this home.
Original Mortgage
$219,550
Interest Rate
7.1%
Mortgage Type
New Conventional
Create a Home Valuation Report for This Property
The Home Valuation Report is an in-depth analysis detailing your home's value as well as a comparison with similar homes in the area
Home Values in the Area
Average Home Value in this Area
Purchase History
| Date | Buyer | Sale Price | Title Company |
|---|---|---|---|
| Alia Samuel M | $255,000 | -- | |
| Alia Samuel M Deborah V Tru | $255,000 | -- | |
| Chapman Derek P | $305,000 | -- | |
| Oliveaux David | $300,000 | -- | |
| Moss Charles A | $258,400 | -- |
Source: Public Records
Mortgage History
| Date | Status | Borrower | Loan Amount |
|---|---|---|---|
| Previous Owner | Chapman Derek P | $244,000 | |
| Previous Owner | Oliveaux David | $240,000 | |
| Previous Owner | Moss Charles A | $219,550 |
Source: Public Records
Tax History Compared to Growth
Tax History
| Year | Tax Paid | Tax Assessment Tax Assessment Total Assessment is a certain percentage of the fair market value that is determined by local assessors to be the total taxable value of land and additions on the property. | Land | Improvement |
|---|---|---|---|---|
| 2025 | $1,784 | $299,440 | $44,080 | $255,360 |
| 2024 | $1,776 | $228,960 | $52,000 | $176,960 |
| 2023 | $1,776 | $243,400 | $50,000 | $193,400 |
| 2022 | $1,730 | $207,680 | $48,400 | $159,280 |
| 2021 | $1,712 | $154,760 | $35,320 | $119,440 |
| 2020 | $1,709 | $147,560 | $32,560 | $115,000 |
| 2019 | $1,572 | $147,560 | $32,560 | $115,000 |
| 2018 | $1,554 | $155,720 | $38,400 | $117,320 |
| 2016 | $1,579 | $143,440 | $34,800 | $108,640 |
| 2015 | $1,611 | $114,680 | $21,200 | $93,480 |
| 2014 | $1,661 | $114,680 | $21,200 | $93,480 |
Source: Public Records
Map
Nearby Homes
- 3540 Hickory Branch Trail
- 3645 Hickory Branch Trail Unit 1
- 515 Morning Creek Ln
- 189 Rutlidge Park Ln
- 325 Morning Mist Walk Unit 2
- 347 Canterbury Place Dr
- 3612 Brookefall Ct
- 682 Montglade Ct Unit 1
- 407 Vista Lake Dr
- 3713 Lake Edge Dr
- 3720 Brookefall Landing
- 812 Holly Meadow Dr
- 665 Roxford Ln Unit 3
- 200 Satellite Blvd NE
- 366 Regal Pines Ct
- 115 Leaf Lake Dr
- 3355 Smithtown Rd
- 358 Rhodes House Ct
- 3580 Hickory Branch Trail
- 3570 Hickory Branch Trail Unit I
- 705 Wood Branch Trail Unit 1
- 3560 Hickory Branch Trail
- 695 Wood Branch Trail
- 3610 Hickory Branch Trail Unit 1
- 3585 Hickory Branch Trail Unit 1
- 3595 Hickory Branch Trail
- 3575 Hickory Branch Trail
- 3575 Hickory Branch Trail
- 3565 Hickory Branch Trail
- 3605 Hickory Branch Trail Unit 1
- 675 Wood Branch Trail
- 3620 Hickory Branch Trail Unit 1
- 0 Hickory Branch Trail Unit 7119240
- 0 Hickory Branch Trail Unit 3148654
- 0 Hickory Branch Trail Unit 8439179
- 0 Hickory Branch Trail Unit 3096259
- 0 Hickory Branch Trail Unit 8801536
- 3555 Hickory Branch Trail Unit 1