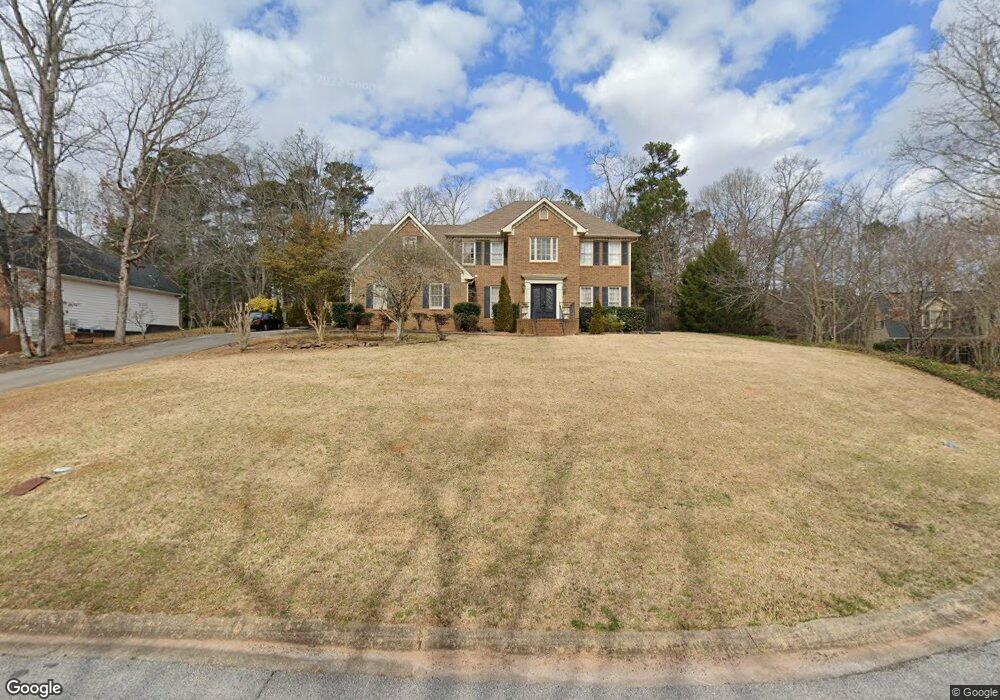
3580 Millers Pond Way Snellville, GA 30039
Estimated Value: $338,000 - $476,000
4
Beds
3
Baths
2,592
Sq Ft
$151/Sq Ft
Est. Value
About This Home
This home is located at 3580 Millers Pond Way, Snellville, GA 30039 and is currently estimated at $390,370, approximately $150 per square foot. 3580 Millers Pond Way is a home located in Gwinnett County with nearby schools including Norton Elementary School, Snellville Middle School, and South Gwinnett High School.
Ownership History
Date
Name
Owned For
Owner Type
Purchase Details
Closed on
May 11, 2017
Sold by
Alloul Abraham
Bought by
Alloul Abraham and Alloul Meriem
Current Estimated Value
Purchase Details
Closed on
Mar 30, 2011
Sold by
Federal Home Loan Mortgage Corporation
Bought by
Alloul Abraham
Home Financials for this Owner
Home Financials are based on the most recent Mortgage that was taken out on this home.
Original Mortgage
$87,400
Interest Rate
4.83%
Mortgage Type
New Conventional
Purchase Details
Closed on
Oct 7, 2008
Sold by
Bank Of America Na
Bought by
Federal Home Loan Mortgage Corporation
Purchase Details
Closed on
Apr 10, 2007
Sold by
Bostick Jennifer L
Bought by
Barton Ronald P
Purchase Details
Closed on
Oct 8, 1996
Sold by
Pirkle Stephen L Deborah
Bought by
Bostick Samuel W Jennifer
Create a Home Valuation Report for This Property
The Home Valuation Report is an in-depth analysis detailing your home's value as well as a comparison with similar homes in the area
Home Values in the Area
Average Home Value in this Area
Purchase History
| Date | Buyer | Sale Price | Title Company |
|---|---|---|---|
| Alloul Abraham | -- | -- | |
| Alloul Abraham | -- | -- | |
| Federal Home Loan Mortgage Corporation | -- | -- | |
| Bank Of America Na | $176,134 | -- | |
| Barton Ronald P | -- | -- | |
| Bostick Samuel W Jennifer | $160,000 | -- |
Source: Public Records
Mortgage History
| Date | Status | Borrower | Loan Amount |
|---|---|---|---|
| Previous Owner | Alloul Abraham | $87,400 | |
| Closed | Bostick Samuel W Jennifer | $0 |
Source: Public Records
Tax History Compared to Growth
Tax History
| Year | Tax Paid | Tax Assessment Tax Assessment Total Assessment is a certain percentage of the fair market value that is determined by local assessors to be the total taxable value of land and additions on the property. | Land | Improvement |
|---|---|---|---|---|
| 2024 | $3,278 | $92,800 | $33,400 | $59,400 |
| 2023 | $3,278 | $136,720 | $33,400 | $103,320 |
| 2022 | $2,885 | $78,000 | $20,000 | $58,000 |
| 2021 | $2,922 | $78,000 | $20,000 | $58,000 |
| 2020 | $2,938 | $90,640 | $20,000 | $70,640 |
| 2019 | $2,955 | $82,040 | $22,880 | $59,160 |
| 2018 | $2,227 | $60,480 | $16,000 | $44,480 |
| 2016 | $1,419 | $36,800 | $22,000 | $14,800 |
| 2015 | $1,433 | $36,800 | $22,000 | $14,800 |
| 2014 | $1,429 | $36,800 | $22,000 | $14,800 |
Source: Public Records
Map
Nearby Homes
- 3630 Millers Pond Way SW
- 3720 Millers Pond Way SW
- 3430 Pate Rd
- 2280 Village Centre Dr Unit 1
- 3206 Pate Creek View
- 2289 Pate Brook Rd
- 3276 Pate Creek View
- 3491 Skyland Ridge Ct
- 3933 Willow Fields Ct
- 4171 Dean Grove Way
- 3635 Andrea Lee Ct
- 3912 Maple Tree Ct
- 2433 Hidden Ln
- 2055 Winnstead Place
- 3186 Laurel Way
- 3414 Preserve Run Trail Unit 5
- 3863 Moos Creek Walk
- 3190 Grand Central Dr
- 3570 Millers Pond Way
- 3590 Millers Pond Way SW
- 3590 Millers Pond Way
- 3560 Millers Pond Way
- 3600 Millers Pond Way
- 3615 Millers Pond Way Unit 1
- 3610 Millers Pond Way
- 3550 Millers Pond Way
- 3575 Millers Pond Way Unit 1
- 3620 Millers Pond Way
- 2460 Temple Johnson Rd
- 3565 Millers Pond Way Unit 1
- 3625 Millers Pond Way
- 3540 Millers Pond Way
- 2470 Temple Johnson Rd
- 3530 Millers Pond Way
- 2437 Millers Pond Ln Unit 1
- 3515 Millers Pond Way SW
- 0 Millers Pond Way SW Unit 8596425
- 0 Millers Pond Way SW Unit 8548064