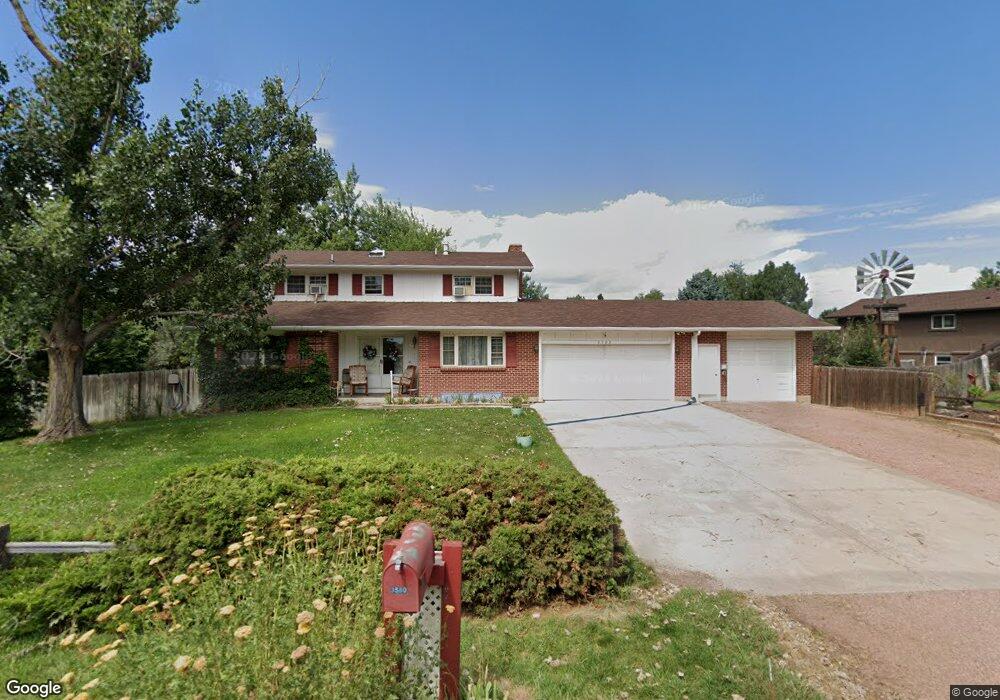
3580 Via Tierra Dr Colorado Springs, CO 80911
Security-Widefield NeighborhoodEstimated Value: $474,368 - $579,000
4
Beds
4
Baths
1,918
Sq Ft
$280/Sq Ft
Est. Value
About This Home
This home is located at 3580 Via Tierra Dr, Colorado Springs, CO 80911 and is currently estimated at $537,592, approximately $280 per square foot. 3580 Via Tierra Dr is a home located in El Paso County with nearby schools including French Elementary School, Sproul Junior High School, and Widefield High School.
Ownership History
Date
Name
Owned For
Owner Type
Purchase Details
Closed on
Apr 30, 1998
Sold by
Stricklin Roy F and Stricklin Margy M
Bought by
Hillman Jeffrey Jack and Wiegers Alice Elizabeth
Current Estimated Value
Home Financials for this Owner
Home Financials are based on the most recent Mortgage that was taken out on this home.
Original Mortgage
$159,505
Outstanding Balance
$31,139
Interest Rate
7.09%
Estimated Equity
$506,453
Purchase Details
Closed on
Nov 30, 1993
Sold by
Meredith Kenneth B and Meredith Deborah A
Bought by
Stricklin Roy F and Stricklin Margy M
Home Financials for this Owner
Home Financials are based on the most recent Mortgage that was taken out on this home.
Original Mortgage
$115,000
Interest Rate
6.71%
Purchase Details
Closed on
May 3, 1991
Bought by
Wiegers Alice E
Purchase Details
Closed on
Aug 1, 1979
Bought by
Hillman Jeffrey J
Create a Home Valuation Report for This Property
The Home Valuation Report is an in-depth analysis detailing your home's value as well as a comparison with similar homes in the area
Home Values in the Area
Average Home Value in this Area
Purchase History
| Date | Buyer | Sale Price | Title Company |
|---|---|---|---|
| Hillman Jeffrey Jack | $167,900 | -- | |
| Stricklin Roy F | -- | -- | |
| Wiegers Alice E | -- | -- | |
| Hillman Jeffrey J | -- | -- |
Source: Public Records
Mortgage History
| Date | Status | Borrower | Loan Amount |
|---|---|---|---|
| Open | Hillman Jeffrey Jack | $159,505 | |
| Previous Owner | Stricklin Roy F | $115,000 |
Source: Public Records
Tax History Compared to Growth
Tax History
| Year | Tax Paid | Tax Assessment Tax Assessment Total Assessment is a certain percentage of the fair market value that is determined by local assessors to be the total taxable value of land and additions on the property. | Land | Improvement |
|---|---|---|---|---|
| 2025 | $2,372 | $37,520 | -- | -- |
| 2024 | $1,812 | $35,480 | $5,750 | $29,730 |
| 2023 | $1,812 | $35,480 | $5,750 | $29,730 |
| 2022 | $1,654 | $29,110 | $3,980 | $25,130 |
| 2021 | $1,783 | $29,940 | $4,090 | $25,850 |
| 2020 | $1,277 | $23,000 | $3,580 | $19,420 |
| 2019 | $1,270 | $23,000 | $3,580 | $19,420 |
| 2018 | $978 | $18,590 | $2,680 | $15,910 |
| 2017 | $989 | $18,590 | $2,680 | $15,910 |
| 2016 | $804 | $19,270 | $2,850 | $16,420 |
| 2015 | $824 | $19,270 | $2,850 | $16,420 |
| 2014 | $715 | $17,810 | $2,560 | $15,250 |
Source: Public Records
Map
Nearby Homes
- 3484 Astana Dr
- 5330 Barnstormers Ave
- 3642 Red Baron Dr
- 3441 Kestrel Dr
- 3211 Poughkeepsie Dr
- 3472 Osprey Ridge Dr
- 3640 Tail Wind Dr
- 3428 Tail Spin Dr
- 3350 Castellon Dr
- 3320 Tail Spin Dr
- 3905 Allgood Dr
- 4929 Raptor Crest Blvd
- 4110 Novia Dr
- 4803 Tory Ridge Dr
- 4882 Hawk Meadow Dr
- 4858 Hawk Meadow Dr
- 4852 Sea Eagle Dr
- 4820 Sea Eagle Dr
- 4773 Live Oak Dr
- 3059 Shikra View
- 3550 Via Tierra Dr
- 3626 W Cresta Loma Cir
- 3605 W Cresta Loma Cir
- 3575 La Mar Place
- 3625 W Cresta Loma Cir
- 3575 Via Tierra Dr
- 3520 Via Tierra Dr
- 3555 Via Tierra Dr
- 3545 La Mar Place
- 3535 Via Tierra Dr
- 3655 W Cresta Loma Cir
- 3570 La Mar Place
- 3635 E Cresta Loma Cir
- 3642 W Cresta Loma Cir
- 3675 W Cresta Loma Cir
- 3540 La Mar Place
- 3640 E Cresta Loma Cir
- 3550 La Mar Place
- 3630 E Cresta Loma Cir
- 3658 W Cresta Loma Cir