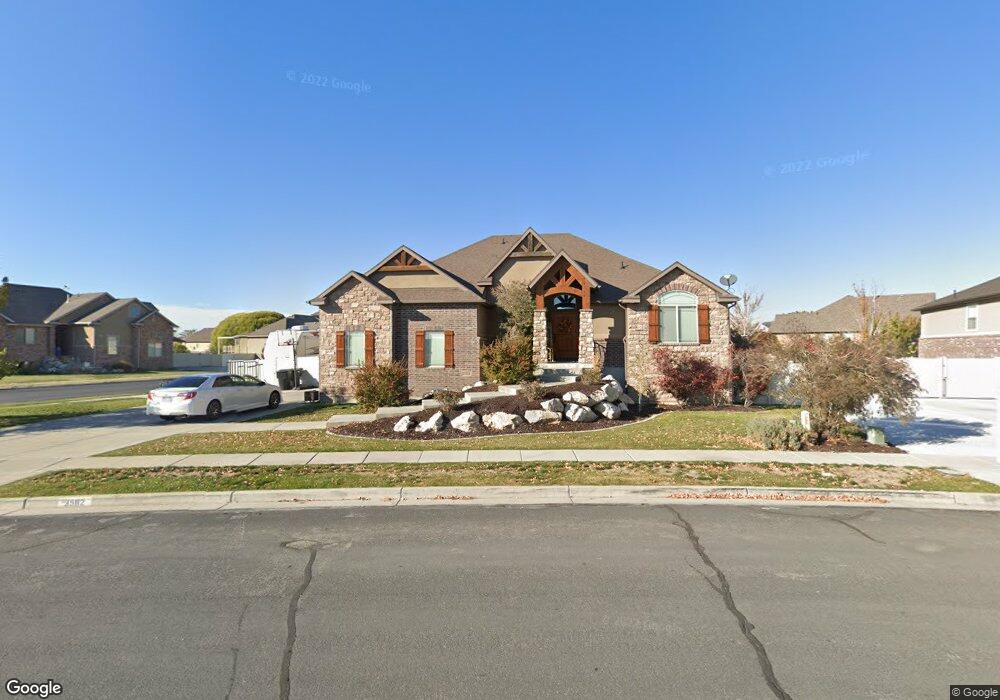
3582 W 1840 S Syracuse, UT 84075
Estimated Value: $684,000 - $760,440
5
Beds
4
Baths
4,096
Sq Ft
$178/Sq Ft
Est. Value
About This Home
This home is located at 3582 W 1840 S, Syracuse, UT 84075 and is currently estimated at $727,360, approximately $177 per square foot. 3582 W 1840 S is a home located in Davis County with nearby schools including Buffalo Point School, Syracuse Junior High School, and Syracuse High School.
Ownership History
Date
Name
Owned For
Owner Type
Purchase Details
Closed on
Oct 18, 2018
Sold by
Barben Jacob S
Bought by
Barben Jacob S and Barben Allison C
Current Estimated Value
Home Financials for this Owner
Home Financials are based on the most recent Mortgage that was taken out on this home.
Original Mortgage
$322,500
Outstanding Balance
$200,875
Interest Rate
4.6%
Mortgage Type
New Conventional
Estimated Equity
$526,485
Purchase Details
Closed on
Sep 14, 2018
Sold by
Barben Jacob S
Bought by
Barben Jacob S and Barben Allison C
Home Financials for this Owner
Home Financials are based on the most recent Mortgage that was taken out on this home.
Original Mortgage
$322,500
Outstanding Balance
$200,875
Interest Rate
4.6%
Mortgage Type
New Conventional
Estimated Equity
$526,485
Purchase Details
Closed on
Jul 21, 2016
Sold by
Barben Jacob S
Bought by
Barben Jacob S and Barben Allison C
Purchase Details
Closed on
Nov 10, 2011
Sold by
The Secretary Of Housing & Urban Develop
Bought by
Barben Jacob Scan and Barben Allison Cleland
Home Financials for this Owner
Home Financials are based on the most recent Mortgage that was taken out on this home.
Original Mortgage
$274,851
Interest Rate
3.87%
Mortgage Type
FHA
Purchase Details
Closed on
Jun 21, 2011
Sold by
Citimortgage Inc
Bought by
Secretary Of Housing & Urban Development
Purchase Details
Closed on
Jun 17, 2011
Sold by
Jensen Lance C and Jensen Charlene
Bought by
Citimortgage Inc
Purchase Details
Closed on
May 27, 2008
Sold by
Nilson & Co Inc
Bought by
Jensen Lance C and Jensen Charlene
Home Financials for this Owner
Home Financials are based on the most recent Mortgage that was taken out on this home.
Original Mortgage
$403,462
Interest Rate
5.87%
Mortgage Type
FHA
Purchase Details
Closed on
Nov 2, 2007
Sold by
Nilson & Co Inc
Bought by
Nilson & Co Inc
Home Financials for this Owner
Home Financials are based on the most recent Mortgage that was taken out on this home.
Original Mortgage
$349,491
Interest Rate
6.38%
Mortgage Type
Purchase Money Mortgage
Purchase Details
Closed on
Apr 4, 2007
Sold by
U S Development Inc
Bought by
Nilson & Co Inc and Nilson Homes
Home Financials for this Owner
Home Financials are based on the most recent Mortgage that was taken out on this home.
Original Mortgage
$179,841
Interest Rate
6.2%
Mortgage Type
Purchase Money Mortgage
Create a Home Valuation Report for This Property
The Home Valuation Report is an in-depth analysis detailing your home's value as well as a comparison with similar homes in the area
Home Values in the Area
Average Home Value in this Area
Purchase History
| Date | Buyer | Sale Price | Title Company |
|---|---|---|---|
| Barben Jacob S | -- | Gt Title Services Sal | |
| Barben Jacob S | -- | Gt Title Services Sai | |
| Barben Jacob S | -- | Gt Title Services Salt Lake | |
| Barben Jacob S | -- | Gt Title Services Salt Lake | |
| Barben Jacob S | -- | American Secure Title | |
| Barben Jacob B | -- | American Secure Title | |
| Barben Jacob Scan | -- | Monument Title Ins Inc | |
| Secretary Of Housing & Urban Development | -- | Backman Title Servic | |
| Citimortgage Inc | $453,463 | Etitle Insurance Age | |
| Jensen Lance C | -- | Bonneville Superior Title Co | |
| Nilson & Co Inc | -- | Accommodation | |
| Nilson & Co Inc | -- | Bonneville Superior Title Co | |
| Jensen Lance C | -- | Bonneville Superior Title Co | |
| Nilson & Co Inc | -- | Bonneville Superior Title Co |
Source: Public Records
Mortgage History
| Date | Status | Borrower | Loan Amount |
|---|---|---|---|
| Open | Barben Jacob S | $322,500 | |
| Closed | Barben Jacob Scan | $274,851 | |
| Previous Owner | Jensen Lance C | $403,462 | |
| Previous Owner | Nilson & Co Inc | $349,491 | |
| Previous Owner | Nilson & Co Inc | $179,841 |
Source: Public Records
Tax History Compared to Growth
Tax History
| Year | Tax Paid | Tax Assessment Tax Assessment Total Assessment is a certain percentage of the fair market value that is determined by local assessors to be the total taxable value of land and additions on the property. | Land | Improvement |
|---|---|---|---|---|
| 2025 | $4,025 | $388,300 | $109,155 | $279,145 |
| 2024 | $3,811 | $370,150 | $91,605 | $278,545 |
| 2023 | $3,571 | $632,000 | $134,125 | $497,875 |
| 2022 | $3,781 | $366,850 | $69,720 | $297,130 |
| 2021 | $3,202 | $486,000 | $101,326 | $384,674 |
| 2020 | $3,122 | $454,000 | $84,539 | $369,461 |
| 2019 | $3,155 | $453,000 | $86,673 | $366,327 |
| 2018 | $2,835 | $404,000 | $83,410 | $320,590 |
| 2016 | $2,655 | $198,385 | $33,595 | $164,790 |
| 2015 | $3,002 | $213,620 | $33,595 | $180,025 |
| 2014 | $3,517 | $255,053 | $33,595 | $221,458 |
| 2013 | -- | $174,334 | $36,748 | $137,586 |
Source: Public Records
Map
Nearby Homes
- 3704 W 2170 S Unit 111
- 1430 Heather Ln
- 3478 Brookshire Dr
- 3360 W 2280 S
- 2982 S 3000 W
- 2912 S 3000 W
- 3867 Rungsted Cir
- 3951 Baltimore Cir
- 4191 W 1425 S
- 2961 S 2425 W Unit 1123
- 1084 S 4090 W
- 895 Dunes Dr
- 1238 S 4290 W
- 2679 W Antelope Dr
- 2840 W 1200 S
- 851 S 3525 W
- 2524 S 3590 W Unit 602
- 2965 S 3000 W
- 2971 S 2425 W Unit 1124
- 2686 S 2440 W Unit 101
- 3562 W 1840 S
- 1837 Doral Dr
- 1837 S Doral Dr
- 1793 Doral Dr
- 1828 Doral Dr
- 1812 Doral Dr
- 3618 W 1840 S
- 1822 S 3525 W Unit 411
- 3569 1840 S
- 3547 W 1840 S Unit 401
- 3547 W 1840 S
- 1792 Doral Dr
- 3547 1840 S
- 1792 S Doral Dr
- 1853 S 3600 W
- 1853 Doral Dr
- 1806 S 3525 W
- 1806 S 3525 W Unit 410
- 3584 W 1775 S
- 1774 Doral Dr