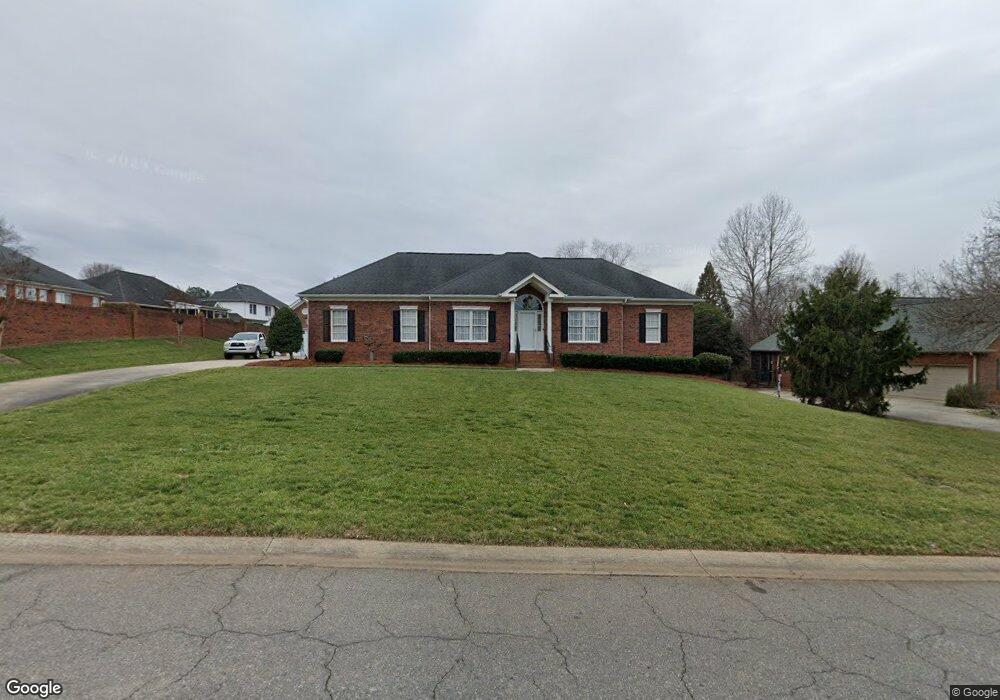
3583 Waterford Ln Gastonia, NC 28056
Estimated Value: $470,625 - $508,000
3
Beds
2
Baths
2,131
Sq Ft
$229/Sq Ft
Est. Value
About This Home
This home is located at 3583 Waterford Ln, Gastonia, NC 28056 and is currently estimated at $487,156, approximately $228 per square foot. 3583 Waterford Ln is a home located in Gaston County with nearby schools including W.A. Bess Elementary School, Cramerton Middle School, and Forestview High School.
Ownership History
Date
Name
Owned For
Owner Type
Purchase Details
Closed on
Feb 17, 2021
Sold by
Mahaffee Joyce W and Mahaffee James D
Bought by
Cobb Tyler C and Cobb Audrey Ellen
Current Estimated Value
Home Financials for this Owner
Home Financials are based on the most recent Mortgage that was taken out on this home.
Original Mortgage
$302,500
Outstanding Balance
$270,319
Interest Rate
2.65%
Mortgage Type
New Conventional
Estimated Equity
$216,837
Purchase Details
Closed on
Aug 13, 2010
Sold by
Earley Jefferson B
Bought by
Earley Joyce W
Purchase Details
Closed on
Feb 27, 1998
Sold by
Pickert Construction Co Inc
Bought by
Earley Jefferson B and Earley Joyce W
Home Financials for this Owner
Home Financials are based on the most recent Mortgage that was taken out on this home.
Original Mortgage
$145,000
Interest Rate
6.86%
Create a Home Valuation Report for This Property
The Home Valuation Report is an in-depth analysis detailing your home's value as well as a comparison with similar homes in the area
Home Values in the Area
Average Home Value in this Area
Purchase History
| Date | Buyer | Sale Price | Title Company |
|---|---|---|---|
| Cobb Tyler C | $336,500 | None Available | |
| Earley Joyce W | -- | None Available | |
| Earley Jefferson B | $203,500 | -- |
Source: Public Records
Mortgage History
| Date | Status | Borrower | Loan Amount |
|---|---|---|---|
| Open | Cobb Tyler C | $302,500 | |
| Previous Owner | Earley Jefferson B | $145,000 |
Source: Public Records
Tax History Compared to Growth
Tax History
| Year | Tax Paid | Tax Assessment Tax Assessment Total Assessment is a certain percentage of the fair market value that is determined by local assessors to be the total taxable value of land and additions on the property. | Land | Improvement |
|---|---|---|---|---|
| 2025 | $4,915 | $459,760 | $61,500 | $398,260 |
| 2024 | $4,915 | $459,760 | $61,500 | $398,260 |
| 2023 | $4,965 | $463,380 | $61,500 | $401,880 |
| 2022 | $4,048 | $304,330 | $40,000 | $264,330 |
| 2021 | $4,108 | $304,330 | $40,000 | $264,330 |
| 2020 | $4,108 | $304,330 | $40,000 | $264,330 |
| 2019 | $4,139 | $304,330 | $40,000 | $264,330 |
| 2018 | $4,143 | $295,931 | $44,000 | $251,931 |
| 2017 | $4,143 | $295,931 | $44,000 | $251,931 |
| 2016 | $4,143 | $295,931 | $0 | $0 |
| 2014 | $3,711 | $265,040 | $55,000 | $210,040 |
Source: Public Records
Map
Nearby Homes
- 2603 Tralee Dr
- 2612 Tralee Dr
- 2615 Bayberry Ct
- 2404 Rosemond Cir Unit 3
- 3619 Baywoods Ct
- 2005 Pinefield Ct
- 2618 Firethorn Ct
- 2409 Woodleigh Dr
- 3425 Araglin Dr
- 3323 Lincoln Ln
- 2509 Firethorn Ct
- 3757 Stoneycreek Ct
- 0 Gaston Day School Rd Unit CAR4275128
- 2424 Flintshire Ln
- 3416 Yarmouth Ln
- 3409 Yarmouth Ln
- 2518 Cove Creek Dr
- 3306 Yarmouth Ln
- 2769 Sawbridge Ln
- 2784 Sawbridge Ln
- 0 Windsong Ct
- 3579 Waterford Ln
- 2317 Pinefield Ct
- 2231 Water Oak Ln
- 2311 Pinefield Ct
- 2604 Tralee Dr
- 2219 Water Oak Ln
- 2598 Ashbourne Dr
- 2224 Water Oak Ln
- 2322 Pinefield Ct
- 2328 Pinefield Ct
- 2316 Pinefield Ct
- 2230 Water Oak Ln
- 2606 Ashbourne Dr
- 2310 Pinefield Ct
- 2611 Tralee Dr
- 2304 Pinefield Ct
- 2218 Water Oak Ln
- 2213 Water Oak Ln
- 3590 Waterford Ln