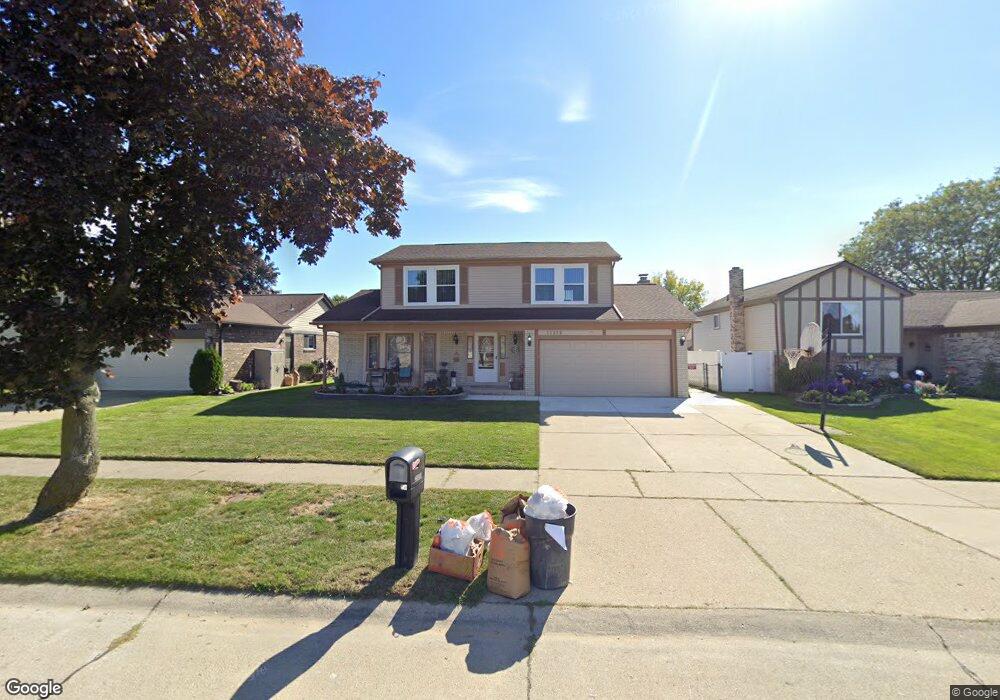
35838 Foothill Dr Sterling Heights, MI 48312
Estimated Value: $342,000 - $386,000
4
Beds
2
Baths
1,986
Sq Ft
$185/Sq Ft
Est. Value
About This Home
This home is located at 35838 Foothill Dr, Sterling Heights, MI 48312 and is currently estimated at $367,045, approximately $184 per square foot. 35838 Foothill Dr is a home located in Macomb County with nearby schools including Willow Woods Elementary School, Carleton Middle School, and Sterling Heights Senior H.S..
Ownership History
Date
Name
Owned For
Owner Type
Purchase Details
Closed on
Dec 14, 2021
Sold by
Stephanie Jarbou
Bought by
Jarbo Weam Najib
Current Estimated Value
Purchase Details
Closed on
Jul 23, 2015
Sold by
Kizy Salah M and Kizy Hanaa
Bought by
Jarbou Stephanie and Jarbou Bianca
Home Financials for this Owner
Home Financials are based on the most recent Mortgage that was taken out on this home.
Original Mortgage
$209,605
Interest Rate
4.03%
Mortgage Type
FHA
Purchase Details
Closed on
Jun 19, 2009
Sold by
Benjamin Joliet
Bought by
Deutsche Bank Trust Company America
Purchase Details
Closed on
Aug 29, 2003
Sold by
Potts Michael E and Potts Jacqueline A
Bought by
Benjamin Joliet
Purchase Details
Closed on
Jul 28, 1995
Sold by
Gandolfi John E
Bought by
Potts Jacqueline A and Potts Michael
Create a Home Valuation Report for This Property
The Home Valuation Report is an in-depth analysis detailing your home's value as well as a comparison with similar homes in the area
Home Values in the Area
Average Home Value in this Area
Purchase History
| Date | Buyer | Sale Price | Title Company |
|---|---|---|---|
| Jarbo Weam Najib | -- | None Listed On Document | |
| Jarbou Stephanie | $215,000 | None Available | |
| Deutsche Bank Trust Company America | $44,485 | None Available | |
| Benjamin Joliet | $224,900 | Title Source | |
| Potts Jacqueline A | $150,000 | -- |
Source: Public Records
Mortgage History
| Date | Status | Borrower | Loan Amount |
|---|---|---|---|
| Previous Owner | Jarbou Stephanie | $209,605 |
Source: Public Records
Tax History Compared to Growth
Tax History
| Year | Tax Paid | Tax Assessment Tax Assessment Total Assessment is a certain percentage of the fair market value that is determined by local assessors to be the total taxable value of land and additions on the property. | Land | Improvement |
|---|---|---|---|---|
| 2025 | $6,059 | $169,600 | $0 | $0 |
| 2024 | $5,844 | $159,200 | $0 | $0 |
| 2023 | $5,548 | $142,600 | $0 | $0 |
| 2022 | $5,380 | $127,700 | $0 | $0 |
| 2021 | $4,790 | $119,000 | $0 | $0 |
| 2020 | $4,553 | $117,200 | $0 | $0 |
| 2019 | $4,490 | $114,400 | $0 | $0 |
| 2018 | $4,530 | $104,500 | $0 | $0 |
| 2017 | $4,367 | $97,700 | $15,000 | $82,700 |
| 2016 | $4,274 | $97,700 | $0 | $0 |
| 2015 | -- | $89,100 | $0 | $0 |
| 2014 | -- | $76,200 | $0 | $0 |
Source: Public Records
Map
Nearby Homes
- 13809 Harbour Ct
- 14041 Brougham Dr
- 35418 Collingwood Dr
- 13830 Bathgate Dr
- 13670 Terra Santa Dr
- 14422 Moravian Manor Cir Unit 44
- 36552 Melbourne Dr
- 35827 Rainbow Dr
- 35408 Grayfield Dr
- 14650 Edshire Dr
- 35238 Moravian Dr
- 35604 Alta Vista Dr
- 14169 Wedgewood Rd
- 14191 Ivanhoe Dr Unit 2
- 35839 Bella Sera Dr Unit 11
- 14202 Shadywood Dr Unit 45
- 34458 Heartsworth Ln
- 36815 Myra Ct
- 34398 Greentrees Rd
- 34400 Preston Dr
- 35850 Foothill Dr
- 35922 Foothill Dr
- 35833 Collingwood Dr
- 35814 Foothill Dr
- 35845 Collingwood Dr
- 35821 Collingwood Dr
- 35857 Collingwood Dr
- 13870 Harbour Ct
- 35809 Collingwood Dr
- 35768 Foothill Dr
- 35934 Foothill Dr
- 35911 Collingwood Dr
- 35925 Foothill Dr
- 35773 Foothill Dr
- 35767 Collingwood Dr
- 35756 Foothill Dr
- 13856 Harbour Ct
- 35923 Collingwood Dr
- 35943 Foothill Dr
- 35755 Collingwood Dr