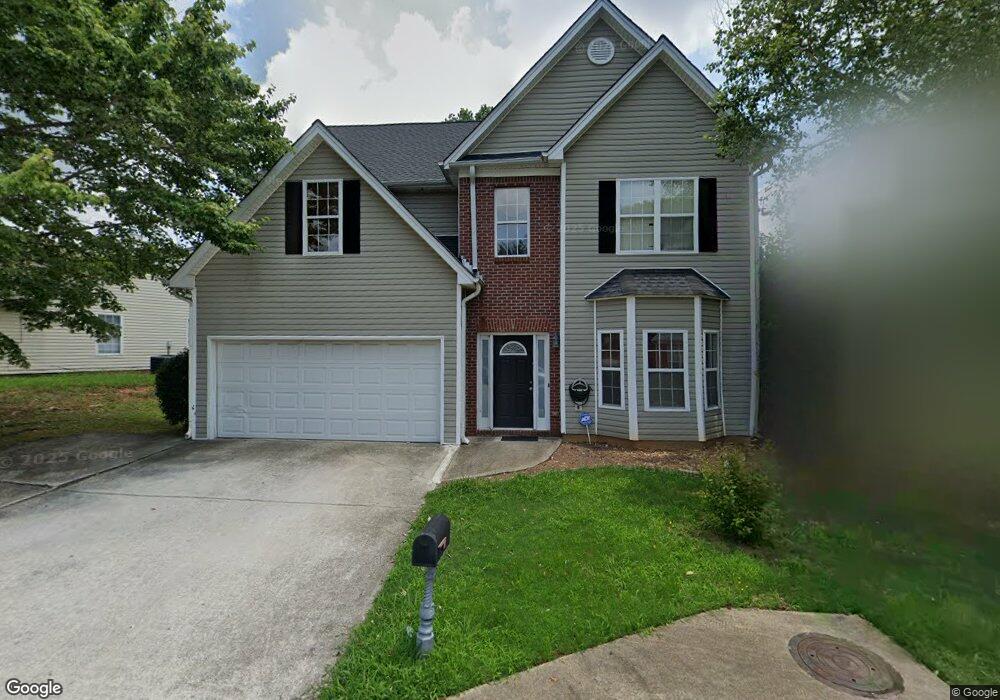
3584 Walnut Creek Way Lithonia, GA 30038
Estimated Value: $262,336 - $311,000
4
Beds
3
Baths
2,092
Sq Ft
$137/Sq Ft
Est. Value
About This Home
This home is located at 3584 Walnut Creek Way, Lithonia, GA 30038 and is currently estimated at $287,084, approximately $137 per square foot. 3584 Walnut Creek Way is a home located in DeKalb County with nearby schools including Flat Rock Elementary School, Salem Middle School, and Martin Luther King- Jr. High School.
Ownership History
Date
Name
Owned For
Owner Type
Purchase Details
Closed on
Nov 8, 2010
Sold by
Federal Natl Mtg Assn Fnma
Bought by
Knight Denoriel M
Current Estimated Value
Home Financials for this Owner
Home Financials are based on the most recent Mortgage that was taken out on this home.
Original Mortgage
$70,810
Outstanding Balance
$46,775
Interest Rate
4.37%
Mortgage Type
New Conventional
Estimated Equity
$240,309
Purchase Details
Closed on
May 4, 2010
Sold by
Onewest Bk Fsb
Bought by
Federal Natl Mtg Assn Fnma
Purchase Details
Closed on
Jan 17, 2002
Sold by
Bowen Builders Grp Inc
Bought by
Dennery Reginald A
Home Financials for this Owner
Home Financials are based on the most recent Mortgage that was taken out on this home.
Original Mortgage
$150,400
Interest Rate
7.16%
Mortgage Type
FHA
Create a Home Valuation Report for This Property
The Home Valuation Report is an in-depth analysis detailing your home's value as well as a comparison with similar homes in the area
Home Values in the Area
Average Home Value in this Area
Purchase History
| Date | Buyer | Sale Price | Title Company |
|---|---|---|---|
| Knight Denoriel M | -- | -- | |
| Federal Natl Mtg Assn Fnma | -- | -- | |
| Onewest Bk Fsb | $191,921 | -- | |
| Dennery Reginald A | $152,900 | -- |
Source: Public Records
Mortgage History
| Date | Status | Borrower | Loan Amount |
|---|---|---|---|
| Open | Knight Denoriel M | $70,810 | |
| Previous Owner | Dennery Reginald A | $150,400 |
Source: Public Records
Tax History Compared to Growth
Tax History
| Year | Tax Paid | Tax Assessment Tax Assessment Total Assessment is a certain percentage of the fair market value that is determined by local assessors to be the total taxable value of land and additions on the property. | Land | Improvement |
|---|---|---|---|---|
| 2025 | $2,897 | $111,520 | $20,000 | $91,520 |
| 2024 | $2,988 | $114,440 | $20,000 | $94,440 |
| 2023 | $2,988 | $110,000 | $20,000 | $90,000 |
| 2022 | $2,393 | $92,880 | $5,040 | $87,840 |
| 2021 | $1,817 | $67,520 | $5,040 | $62,480 |
| 2020 | $1,654 | $60,560 | $5,040 | $55,520 |
| 2019 | $1,669 | $61,200 | $5,040 | $56,160 |
| 2018 | $1,361 | $54,960 | $5,040 | $49,920 |
| 2017 | $1,429 | $49,640 | $5,040 | $44,600 |
| 2016 | $1,239 | $42,240 | $5,040 | $37,200 |
| 2014 | $1,023 | $32,720 | $5,040 | $27,680 |
Source: Public Records
Map
Nearby Homes
- 3598 Walnut Creek Way
- 3578 Walnut Creek Way
- 5211 Walnut Ct
- 5201 Walnut Ct
- 3604 Walnut Creek Way
- 5217 Walnut Ct
- 3583 Walnut Creek Way
- 3591 Walnut Creek Way
- 5229 Walnut Ct
- 3608 Walnut Creek Way
- 3597 Walnut Creek Way
- 3577 Walnut Creek Way
- 3571 Walnut Creek Way
- 3605 Walnut Creek Way
- 0 Walnut Ct Unit 7098238
- 0 Walnut Ct Unit 7057641
- 0 Walnut Ct Unit 3219607
- 0 Walnut Ct Unit 8300869
- 0 Walnut Ct Unit 3244742
- 0 Walnut Ct Unit 3220416