3585 P Loop Washougal, WA 98671
Estimated Value: $643,335 - $818,000
3
Beds
3
Baths
2,379
Sq Ft
$313/Sq Ft
Est. Value
About This Home
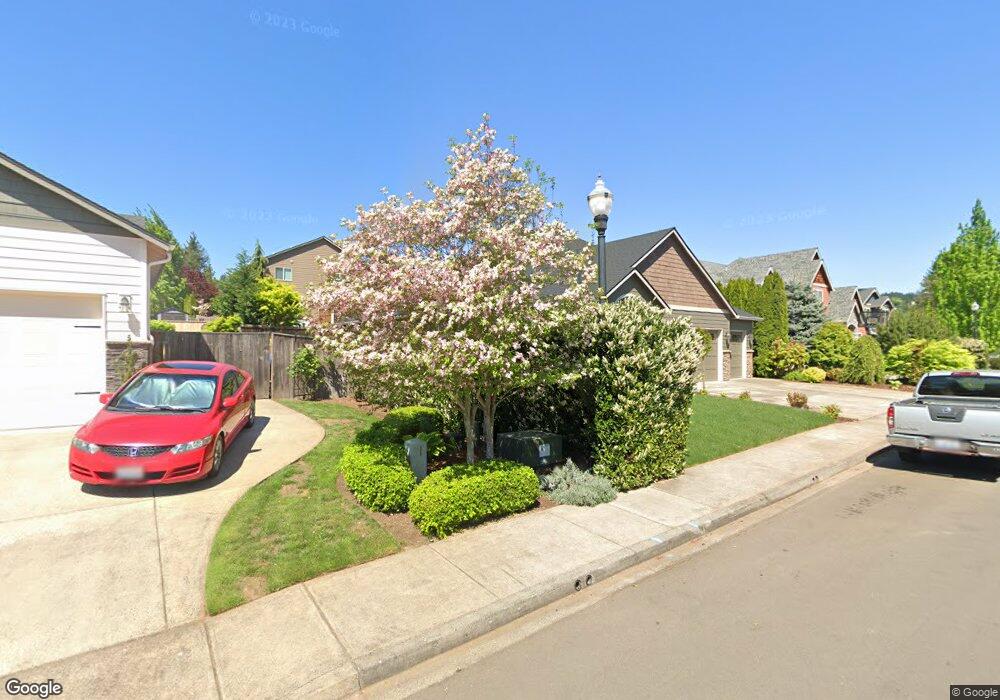
This home is located at 3585 P Loop, Washougal, WA 98671 and is currently estimated at $744,084, approximately $312 per square foot. 3585 P Loop is a home located in Clark County with nearby schools including Gause Elementary School, Jemtegaard Middle School, and Washougal High School.
Ownership History
Date
Name
Owned For
Owner Type
Purchase Details
Closed on
Sep 15, 2008
Sold by
Jackson Bobby W
Bought by
Jackson Valerie I
Current Estimated Value
Purchase Details
Closed on
Jul 16, 2008
Sold by
Harbour Bay Homes Llc
Bought by
Jackson Bobby W and Jackson Valerie I
Home Financials for this Owner
Home Financials are based on the most recent Mortgage that was taken out on this home.
Original Mortgage
$303,200
Outstanding Balance
$195,603
Interest Rate
6.07%
Mortgage Type
Purchase Money Mortgage
Estimated Equity
$548,481
Purchase Details
Closed on
Apr 7, 2006
Sold by
Allegro Ridge Llc
Bought by
Harbour Bay Homes Llc
Home Financials for this Owner
Home Financials are based on the most recent Mortgage that was taken out on this home.
Original Mortgage
$372,000
Interest Rate
6.2%
Mortgage Type
Purchase Money Mortgage
Create a Home Valuation Report for This Property
The Home Valuation Report is an in-depth analysis detailing your home's value as well as a comparison with similar homes in the area
Home Values in the Area
Average Home Value in this Area
Purchase History
| Date | Buyer | Sale Price | Title Company |
|---|---|---|---|
| Jackson Valerie I | -- | None Available | |
| Jackson Bobby W | $379,000 | Cascade Title | |
| Harbour Bay Homes Llc | $100,000 | Cascade Title |
Source: Public Records
Mortgage History
| Date | Status | Borrower | Loan Amount |
|---|---|---|---|
| Open | Jackson Bobby W | $303,200 | |
| Previous Owner | Harbour Bay Homes Llc | $372,000 |
Source: Public Records
Tax History Compared to Growth
Tax History
| Year | Tax Paid | Tax Assessment Tax Assessment Total Assessment is a certain percentage of the fair market value that is determined by local assessors to be the total taxable value of land and additions on the property. | Land | Improvement |
|---|---|---|---|---|
| 2025 | $5,688 | $612,036 | $120,000 | $492,036 |
| 2024 | $5,496 | $599,771 | $144,000 | $455,771 |
| 2023 | $5,363 | $606,481 | $154,800 | $451,681 |
| 2022 | $5,314 | $579,513 | $154,800 | $424,713 |
| 2021 | $5,173 | $498,288 | $132,000 | $366,288 |
| 2020 | $4,926 | $455,111 | $120,000 | $335,111 |
| 2019 | $4,637 | $440,236 | $120,000 | $320,236 |
| 2018 | $5,350 | $438,139 | $0 | $0 |
| 2017 | $4,643 | $417,315 | $0 | $0 |
| 2016 | $4,497 | $397,749 | $0 | $0 |
| 2015 | $4,245 | $352,335 | $0 | $0 |
| 2014 | -- | $330,839 | $0 | $0 |
| 2013 | -- | $293,704 | $0 | $0 |
Source: Public Records
Map
Nearby Homes