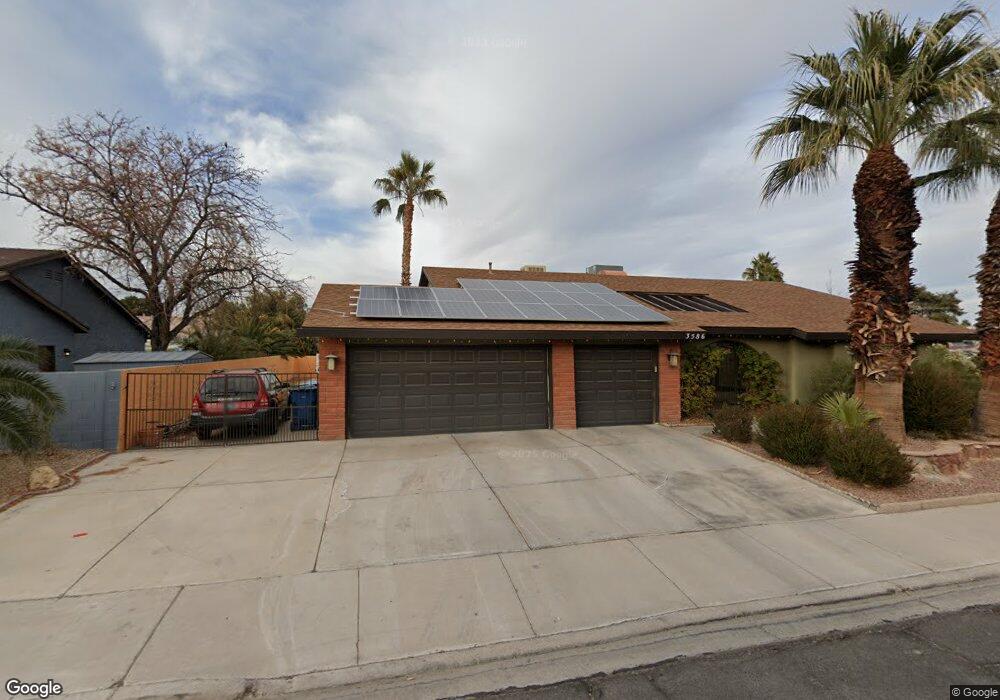
3586 Sandcliff Ln Las Vegas, NV 89121
Paradise Valley East NeighborhoodEstimated Value: $420,611 - $480,000
3
Beds
2
Baths
1,773
Sq Ft
$256/Sq Ft
Est. Value
About This Home
This home is located at 3586 Sandcliff Ln, Las Vegas, NV 89121 and is currently estimated at $453,403, approximately $255 per square foot. 3586 Sandcliff Ln is a home located in Clark County with nearby schools including George E. Harris Elementary School, C.W. Woodbury Middle School, and Chaparral High School.
Ownership History
Date
Name
Owned For
Owner Type
Purchase Details
Closed on
Jul 29, 2024
Sold by
Shelvin Jennifer and Ecklund Christopher B
Bought by
Ecklund Christopher Bruce and Ecklund Jennifer Lynn
Current Estimated Value
Purchase Details
Closed on
Oct 12, 2007
Sold by
Braden David M
Bought by
Ecklund Christopher B and Shelvin Jennifer
Home Financials for this Owner
Home Financials are based on the most recent Mortgage that was taken out on this home.
Original Mortgage
$256,000
Interest Rate
6.27%
Mortgage Type
Unknown
Purchase Details
Closed on
Dec 2, 2002
Sold by
Braden Dawn A
Bought by
Braden David M
Home Financials for this Owner
Home Financials are based on the most recent Mortgage that was taken out on this home.
Original Mortgage
$135,200
Interest Rate
7.25%
Purchase Details
Closed on
Nov 25, 2002
Sold by
Vecchioli John and Vecchioli Lillian
Bought by
Braden David M
Home Financials for this Owner
Home Financials are based on the most recent Mortgage that was taken out on this home.
Original Mortgage
$135,200
Interest Rate
7.25%
Create a Home Valuation Report for This Property
The Home Valuation Report is an in-depth analysis detailing your home's value as well as a comparison with similar homes in the area
Home Values in the Area
Average Home Value in this Area
Purchase History
| Date | Buyer | Sale Price | Title Company |
|---|---|---|---|
| Ecklund Christopher Bruce | -- | None Listed On Document | |
| Ecklund Christopher B | $320,000 | Nevada State Title | |
| Braden David M | -- | Equity Title | |
| Braden David M | $169,000 | Equity Title |
Source: Public Records
Mortgage History
| Date | Status | Borrower | Loan Amount |
|---|---|---|---|
| Previous Owner | Ecklund Christopher B | $256,000 | |
| Previous Owner | Braden David M | $135,200 | |
| Closed | Braden David M | $33,800 |
Source: Public Records
Tax History Compared to Growth
Tax History
| Year | Tax Paid | Tax Assessment Tax Assessment Total Assessment is a certain percentage of the fair market value that is determined by local assessors to be the total taxable value of land and additions on the property. | Land | Improvement |
|---|---|---|---|---|
| 2025 | $1,294 | $78,214 | $41,528 | $36,686 |
| 2024 | $1,257 | $78,214 | $41,528 | $36,686 |
| 2023 | $1,257 | $78,689 | $42,350 | $36,339 |
| 2022 | $1,221 | $68,986 | $35,000 | $33,986 |
| 2021 | $1,185 | $65,636 | $32,550 | $33,086 |
| 2020 | $1,148 | $65,972 | $32,550 | $33,422 |
| 2019 | $1,114 | $56,966 | $23,450 | $33,516 |
| 2018 | $1,082 | $53,588 | $20,650 | $32,938 |
| 2017 | $1,597 | $54,463 | $20,650 | $33,813 |
| 2016 | $1,026 | $50,473 | $15,750 | $34,723 |
| 2015 | $1,023 | $47,020 | $12,250 | $34,770 |
| 2014 | $993 | $32,837 | $12,250 | $20,587 |
Source: Public Records
Map
Nearby Homes
- 4501 Woodcrest Rd
- 3475 E Rochelle Ave
- 3430 Tanto Cir
- 3421 Rochelle Ct
- 3753 Mountcrest Dr
- 3689 N Rosecrest Cir
- 4515 Goen Way
- 3525 Raina Ridge Ct
- 4574 Sheri Lyn Ct
- 3646 Billman Ave
- 4220 W Pinecrest Cir
- 4318 Ridgecrest Dr
- 4202 W Pinecrest Cir
- 4485 Greenhill Dr
- 4650 White Rock Dr
- 3363 Zephyr Ct
- 3855 Mayhill Ave
- 3305 Fairview Ln
- 3374 China Dr
- 4567 Kenmare Way
- 3572 Sandcliff Ln
- 4379 S Pearl St
- 4335 S Pearl St
- 4345 S Pearl St
- 4371 Woodcrest Rd
- 4380 Sunny Dunes Dr
- 3558 Sandcliff Ln
- 4389 Woodcrest Rd
- 4353 Woodcrest Rd
- 4391 S Pearl St
- 4407 Woodcrest Rd
- 4392 Sunny Dunes Dr
- 4355 S Pearl St
- 3595 E Rochelle Ave
- 4379 Sunny Dunes Dr
- 4335 Woodcrest Rd
- 4403 S Pearl St
- 3575 E Rochelle Ave
- 4404 Sunny Dunes Dr
- 4391 Sunny Dunes Dr