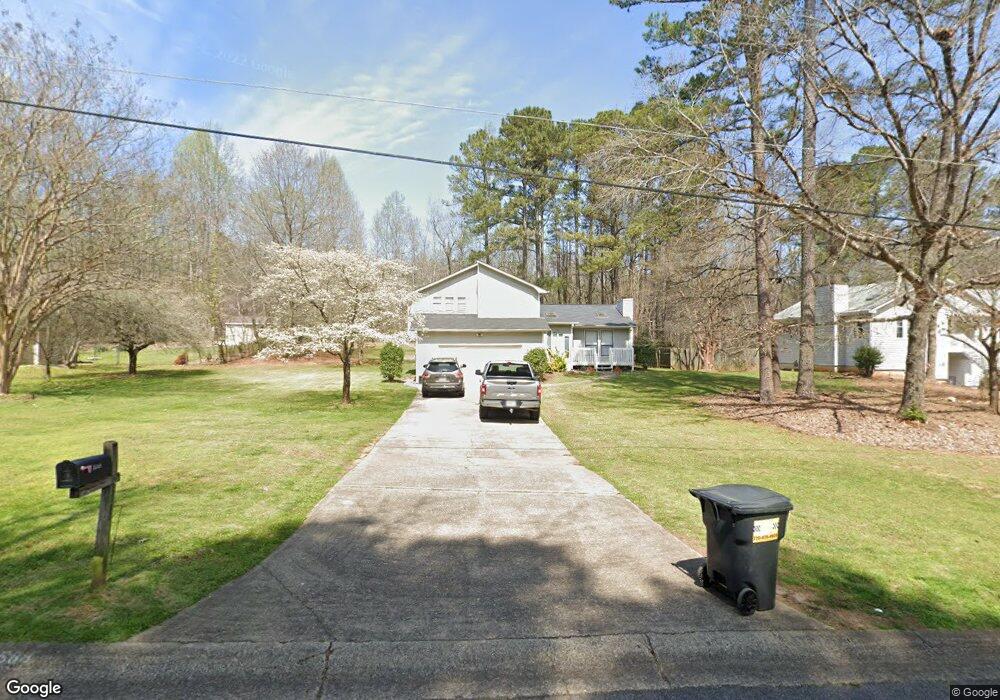
3588 Pine Branches Ct Acworth, GA 30102
Oak Grove NeighborhoodEstimated Value: $364,000 - $367,738
3
Beds
2
Baths
1,420
Sq Ft
$258/Sq Ft
Est. Value
About This Home
This home is located at 3588 Pine Branches Ct, Acworth, GA 30102 and is currently estimated at $365,869, approximately $257 per square foot. 3588 Pine Branches Ct is a home located in Cherokee County with nearby schools including E. T. Booth Middle School, Etowah High School, and Furtah Preparatory School.
Ownership History
Date
Name
Owned For
Owner Type
Purchase Details
Closed on
Oct 30, 2024
Sold by
Alto Asset Co 2 Llc
Bought by
Montpelier Assets Llc
Current Estimated Value
Purchase Details
Closed on
Mar 4, 2020
Sold by
Luxor Sfr Spv 1 Llc
Bought by
Alto Asset Co 2 Llc
Purchase Details
Closed on
Jun 28, 2018
Sold by
Firebird Sfe I Llc
Bought by
Luxor Sfr Spv 1 Llc and C/O Luxor Capital Grp Lp
Purchase Details
Closed on
Jul 5, 2017
Sold by
Thompson Tammy
Bought by
Firebird Sfe I Llc
Purchase Details
Closed on
Aug 28, 2007
Sold by
Ace Securities 2005-Asap1
Bought by
Thompson Tammy
Home Financials for this Owner
Home Financials are based on the most recent Mortgage that was taken out on this home.
Original Mortgage
$130,500
Interest Rate
6.65%
Purchase Details
Closed on
May 1, 2007
Sold by
Barfield Arthur A and Barfield Shawna L
Bought by
Ace Securities Corp 2005-Asap1
Purchase Details
Closed on
May 3, 2005
Sold by
Long James S
Bought by
Barfield Arthur A and Barfield Shawna
Home Financials for this Owner
Home Financials are based on the most recent Mortgage that was taken out on this home.
Original Mortgage
$27,400
Interest Rate
5.88%
Mortgage Type
Stand Alone Refi Refinance Of Original Loan
Create a Home Valuation Report for This Property
The Home Valuation Report is an in-depth analysis detailing your home's value as well as a comparison with similar homes in the area
Home Values in the Area
Average Home Value in this Area
Purchase History
| Date | Buyer | Sale Price | Title Company |
|---|---|---|---|
| Montpelier Assets Llc | $2,197,541 | -- | |
| Alto Asset Co 2 Llc | $1,284,773 | -- | |
| Luxor Sfr Spv 1 Llc | $186,776 | -- | |
| Firebird Sfe I Llc | $150,000 | -- | |
| Thompson Tammy | $130,500 | -- | |
| Ace Securities Corp 2005-Asap1 | $120,568 | -- | |
| Barfield Arthur A | $137,000 | -- |
Source: Public Records
Mortgage History
| Date | Status | Borrower | Loan Amount |
|---|---|---|---|
| Previous Owner | Thompson Tammy | $130,500 | |
| Previous Owner | Barfield Arthur A | $27,400 |
Source: Public Records
Tax History Compared to Growth
Tax History
| Year | Tax Paid | Tax Assessment Tax Assessment Total Assessment is a certain percentage of the fair market value that is determined by local assessors to be the total taxable value of land and additions on the property. | Land | Improvement |
|---|---|---|---|---|
| 2025 | $3,363 | $128,064 | $28,000 | $100,064 |
| 2024 | $3,439 | $132,320 | $26,497 | $105,823 |
| 2023 | $3,439 | $132,320 | $26,497 | $105,823 |
| 2022 | $2,853 | $108,544 | $24,000 | $84,544 |
| 2021 | $2,509 | $88,384 | $17,600 | $70,784 |
| 2020 | $2,397 | $84,344 | $17,600 | $66,744 |
| 2019 | $2,116 | $74,480 | $16,000 | $58,480 |
| 2018 | $1,715 | $60,000 | $13,600 | $46,400 |
| 2017 | $1,461 | $153,900 | $13,600 | $47,960 |
| 2016 | $1,461 | $131,200 | $12,000 | $40,480 |
| 2015 | $1,419 | $126,400 | $12,000 | $38,560 |
| 2014 | $1,283 | $114,600 | $10,000 | $35,840 |
Source: Public Records
Map
Nearby Homes
- 3500 Twin Pines Dr
- 3375 Spinnaker Way
- 0 Jacobs Rd SE Unit 7534888
- 3470 Hill Ln
- 3487 Kellogg Creek Rd
- 4079 Arrington Rd SE
- 0 E Emerald Oaks Dr Unit 10591658
- 10 Mariner Way SE
- 5900 Jacobs Rd
- 3415 Spinnaker Way
- 5767 James Rd
- 135 Boones Ridge Pkwy SE
- 4160 Hall St SE
- 6168 Emerald Springs Way SE
- 3720 James Rd
- 22 Allatoona Estates Dr SE
- 2279 Highway 92
- 3592 Pine Branches Ct
- 3584 Pine Branches Ct
- 3580 Pine Branches Ct
- 3596 Pine Branches Ct
- 3595 Pine Branches Ct
- 6198 Brookside Ln Unit 6198
- 6198 Brookside Ln
- 3576 Pine Branches Ct
- 0 Pine Branches Ct Unit 3195799
- 0 Pine Branches Ct Unit 7406993
- 0 Pine Branches Ct Unit 7149843
- 0 Pine Branches Ct Unit 8823276
- 0 Pine Branches Ct Unit 8733181
- 0 Pine Branches Ct Unit 8462422
- 0 Pine Branches Ct Unit 8277829
- 0 Pine Branches Ct
- 6150 Brook Ln
- 6138 Brook Ln
- 6195 Brookside Ln
- 6192 Brookside Ln