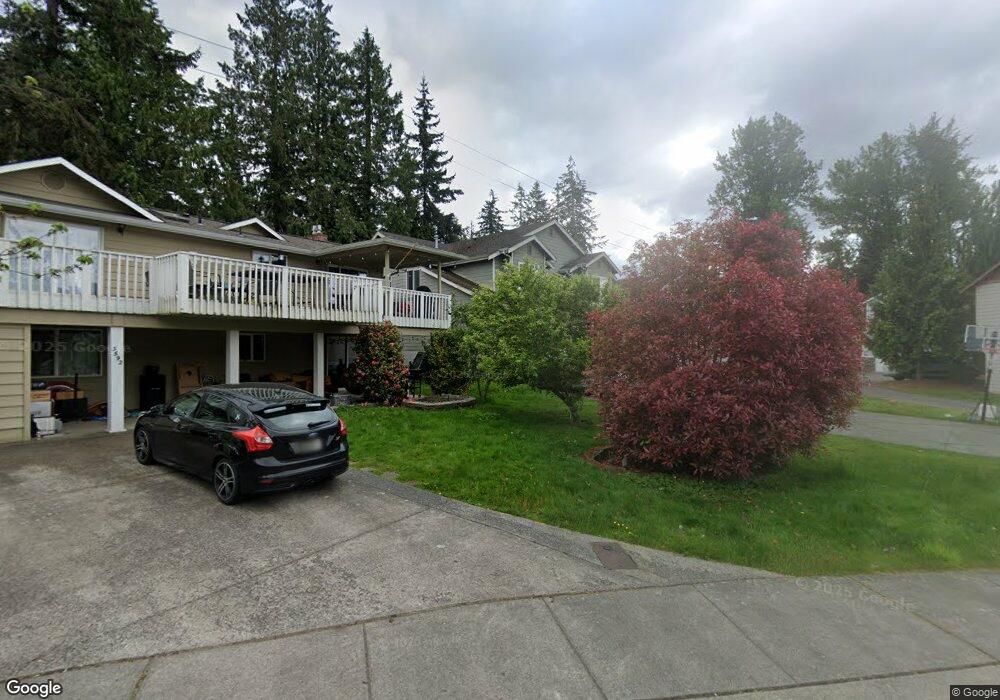
3588 Skylark Loop Bellingham, WA 98226
Barkley NeighborhoodEstimated Value: $621,000 - $753,000
4
Beds
3
Baths
2,152
Sq Ft
$327/Sq Ft
Est. Value
About This Home
This home is located at 3588 Skylark Loop, Bellingham, WA 98226 and is currently estimated at $703,495, approximately $326 per square foot. 3588 Skylark Loop is a home located in Whatcom County with nearby schools including Northern Heights Elementary School, Shuksan Middle School, and Squalicum High School.
Ownership History
Date
Name
Owned For
Owner Type
Purchase Details
Closed on
Nov 19, 2018
Sold by
Payne Frederick
Bought by
Kimmie Trela
Current Estimated Value
Purchase Details
Closed on
May 4, 2011
Sold by
Fannie Mae
Bought by
Payne Frederick and Kimmie Trela
Home Financials for this Owner
Home Financials are based on the most recent Mortgage that was taken out on this home.
Original Mortgage
$264,130
Interest Rate
4.84%
Mortgage Type
FHA
Purchase Details
Closed on
Jan 3, 2011
Sold by
Walker Michael D
Bought by
Federal National Mortgage Association
Purchase Details
Closed on
Dec 14, 2006
Sold by
Dietrich Construction Co Llc
Bought by
Walker Michael D
Home Financials for this Owner
Home Financials are based on the most recent Mortgage that was taken out on this home.
Original Mortgage
$318,250
Interest Rate
6.12%
Mortgage Type
Purchase Money Mortgage
Purchase Details
Closed on
Nov 10, 2005
Sold by
Dietrich R Dean and Lois Dietrich E
Bought by
Dietrich Construction Co Llc
Create a Home Valuation Report for This Property
The Home Valuation Report is an in-depth analysis detailing your home's value as well as a comparison with similar homes in the area
Home Values in the Area
Average Home Value in this Area
Purchase History
| Date | Buyer | Sale Price | Title Company |
|---|---|---|---|
| Kimmie Trela | $322,850 | None Available | |
| Payne Frederick | $271,000 | Chicago Title Insurance | |
| Federal National Mortgage Association | $402,505 | Chicago Title Insurance | |
| Walker Michael D | $335,280 | Stewart Title Company | |
| Dietrich Construction Co Llc | -- | -- |
Source: Public Records
Mortgage History
| Date | Status | Borrower | Loan Amount |
|---|---|---|---|
| Previous Owner | Payne Frederick | $264,130 | |
| Previous Owner | Walker Michael D | $318,250 |
Source: Public Records
Tax History Compared to Growth
Tax History
| Year | Tax Paid | Tax Assessment Tax Assessment Total Assessment is a certain percentage of the fair market value that is determined by local assessors to be the total taxable value of land and additions on the property. | Land | Improvement |
|---|---|---|---|---|
| 2024 | $5,045 | $620,969 | $211,408 | $409,561 |
| 2023 | $5,045 | $648,274 | $220,704 | $427,570 |
| 2022 | $4,365 | $568,661 | $193,600 | $375,061 |
| 2021 | $4,286 | $469,968 | $160,000 | $309,968 |
| 2020 | $4,185 | $435,461 | $109,039 | $326,422 |
| 2019 | $3,753 | $406,814 | $101,955 | $304,859 |
| 2018 | $3,883 | $364,881 | $91,455 | $273,426 |
| 2017 | $3,382 | $322,850 | $80,920 | $241,930 |
| 2016 | $3,332 | $293,357 | $73,640 | $219,717 |
| 2015 | $3,267 | $279,554 | $70,000 | $209,554 |
| 2014 | -- | $266,535 | $72,240 | $194,295 |
| 2013 | -- | $254,998 | $70,000 | $184,998 |
Source: Public Records
Map
Nearby Homes
- 3606 Tree Farm Ct
- 3715 E Sunset Dr
- 3817 E Sunset Dr
- 3713 Bristol St
- 3709 Bristol St
- 3001 E Sunset Dr
- 3010 E Sunset Dr
- 0 E Bakerview Rd Unit NWM2398341
- 1314 Welling Rd
- 2870 E Bakerview Rd
- 3527 Sussex Dr
- 1368 Roma Rd
- 3827 Keystone Way
- 2809 E Sunset Dr
- 1379 Northwood Ct
- 1430 Welling Rd
- 4160 Hannegan Rd
- 3159 Chandler Pkwy
- 3155 Chandler Pkwy
- 3153 Chandler Pkwy
- 3584 Skylark Loop
- 3592 Skylark Loop
- 35 Skylark Loop
- 3596 Skylark Loop
- 3572 Skylark Loop
- 3576 Skylark Loop
- 3580 Skylark Loop
- 3600 Skylark Loop
- 3566 Skylark Loop
- 3577 Skylark Loop
- 3595 Skylark Loop
- 3573 Skylark Loop
- 3604 Skylark Loop
- 3554 Skylark Loop
- 3569 Skylark Loop
- 3548 Skylark Loop
- 3608 Skylark Loop
- 3565 Skylark Loop
- 3544 Skylark Loop
- 3557 Skylark Loop