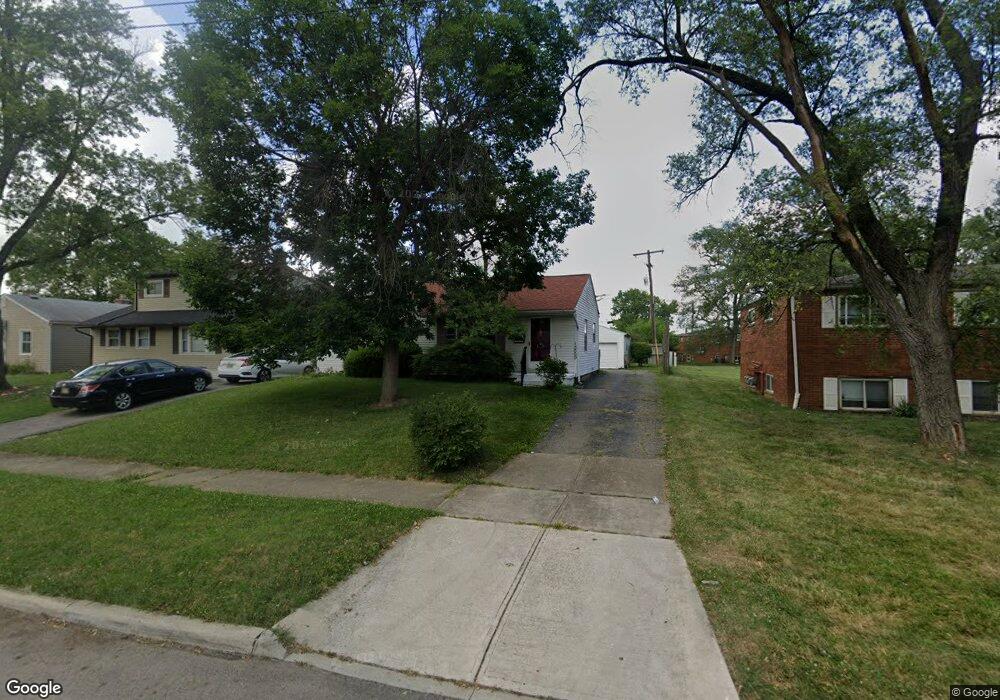
3589 Beulah Rd Columbus, OH 43224
North Linden NeighborhoodEstimated Value: $188,000 - $228,000
3
Beds
1
Bath
912
Sq Ft
$232/Sq Ft
Est. Value
About This Home
This home is located at 3589 Beulah Rd, Columbus, OH 43224 and is currently estimated at $211,497, approximately $231 per square foot. 3589 Beulah Rd is a home located in Franklin County with nearby schools including Maize Road Elementary School, Medina Middle School, and Mifflin High School.
Ownership History
Date
Name
Owned For
Owner Type
Purchase Details
Closed on
May 28, 2003
Sold by
Neuhart Bradley K
Bought by
Moniger Norman R and Moniger Eleanor L
Current Estimated Value
Home Financials for this Owner
Home Financials are based on the most recent Mortgage that was taken out on this home.
Original Mortgage
$93,433
Outstanding Balance
$39,869
Interest Rate
5.9%
Mortgage Type
FHA
Estimated Equity
$171,628
Purchase Details
Closed on
May 5, 2000
Sold by
Neuhart Robin
Bought by
Neuhart Bradley K
Purchase Details
Closed on
Jan 22, 1999
Sold by
Dawson Sherrill J
Bought by
Neuhart Brad K and Neuhart Robin A
Home Financials for this Owner
Home Financials are based on the most recent Mortgage that was taken out on this home.
Original Mortgage
$59,816
Interest Rate
6.76%
Mortgage Type
FHA
Purchase Details
Closed on
Dec 1, 1986
Create a Home Valuation Report for This Property
The Home Valuation Report is an in-depth analysis detailing your home's value as well as a comparison with similar homes in the area
Home Values in the Area
Average Home Value in this Area
Purchase History
| Date | Buyer | Sale Price | Title Company |
|---|---|---|---|
| Moniger Norman R | $94,900 | Contract Processing & Title | |
| Neuhart Bradley K | -- | -- | |
| Neuhart Brad K | $65,000 | Lawyers Title | |
| -- | $39,900 | -- |
Source: Public Records
Mortgage History
| Date | Status | Borrower | Loan Amount |
|---|---|---|---|
| Open | Moniger Norman R | $93,433 | |
| Closed | Neuhart Brad K | $59,816 |
Source: Public Records
Tax History
| Year | Tax Paid | Tax Assessment Tax Assessment Total Assessment is a certain percentage of the fair market value that is determined by local assessors to be the total taxable value of land and additions on the property. | Land | Improvement |
|---|---|---|---|---|
| 2025 | $2,379 | $62,800 | $14,460 | $48,340 |
| 2024 | $2,379 | $62,800 | $14,460 | $48,340 |
| 2023 | $2,376 | $62,790 | $14,455 | $48,335 |
| 2022 | $1,462 | $36,930 | $6,970 | $29,960 |
| 2021 | $1,464 | $36,930 | $6,970 | $29,960 |
| 2020 | $1,466 | $36,930 | $6,970 | $29,960 |
| 2019 | $1,221 | $28,880 | $5,570 | $23,310 |
| 2018 | $1,119 | $28,880 | $5,570 | $23,310 |
| 2017 | $1,220 | $28,880 | $5,570 | $23,310 |
| 2016 | $1,122 | $25,690 | $5,600 | $20,090 |
| 2015 | $1,019 | $25,690 | $5,600 | $20,090 |
| 2014 | $1,021 | $25,690 | $5,600 | $20,090 |
| 2013 | $543 | $27,020 | $5,880 | $21,140 |
Source: Public Records
Map
Nearby Homes
- 3546 Beulah Rd
- 780 Moon Rd
- 991 Hidden Acres Ct Unit 991
- 544 Piedmont Rd
- 1046 Northridge Rd
- 528 Arden Rd
- 796 E Kenworth Rd
- 531 Richards Rd
- 1090 Pauline Ave
- 467 Brevoort Rd
- 1120 Piedmont Rd
- 589 Clinton Heights Ave
- 398 Fallis Rd
- 440 Chatham Rd
- 1242 Acton Rd
- 374 Acton Rd
- 759 E Longview Ave
- 914 Weldon Ave
- 3035 Audubon Rd
- 3147 Grasmere Ave
- 3583 Beulah Rd
- 3577 Beulah Rd
- 3600 Beulah Rd
- 3600 Beulah Rd
- 3617 Beulah Rd Unit C
- 3617 Beulah Rd
- 3588 Beulah Rd
- 3563 Beulah Rd
- 3576 Beulah Rd
- 3555 Beulah Rd
- 3560 Beulah Rd
- 3547 Beulah Rd
- 3628 Beulah Rd
- 3554 Beulah Rd
- 3581 Eisenhower Rd
- 3575 Eisenhower Rd
- 3567 Eisenhower Rd
- 3591 Eisenhower Rd
- 3541 Beulah Rd
- 3601 Eisenhower Rd
Your Personal Tour Guide
Ask me questions while you tour the home.