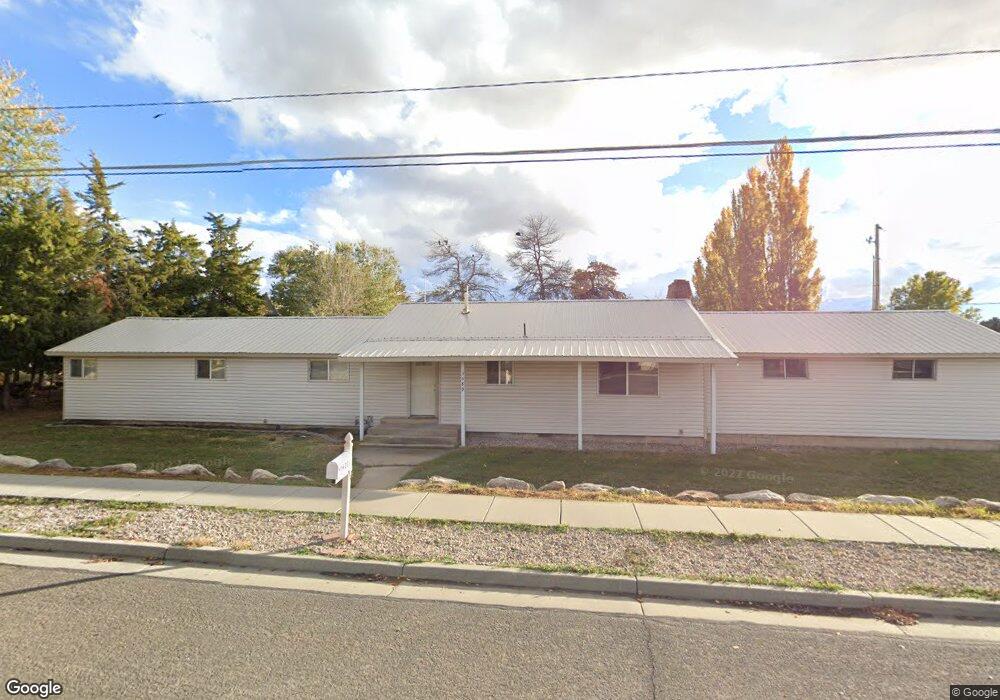
3589 W 1000 N Layton, UT 84041
Estimated Value: $507,000 - $580,259
4
Beds
2
Baths
1,578
Sq Ft
$338/Sq Ft
Est. Value
About This Home
This home is located at 3589 W 1000 N, Layton, UT 84041 and is currently estimated at $532,815, approximately $337 per square foot. 3589 W 1000 N is a home located in Davis County with nearby schools including Sand Springs Elementary School, Legacy Junior High School, and Layton High School.
Ownership History
Date
Name
Owned For
Owner Type
Purchase Details
Closed on
Dec 18, 2017
Sold by
Belangdal Nicandro
Bought by
Belangdal Nicandro and Belangdal Cherrie Vie
Current Estimated Value
Purchase Details
Closed on
Sep 21, 1998
Sold by
Thurgood Robert L and Thurgood Beverly S
Bought by
Gmw Development Inc
Home Financials for this Owner
Home Financials are based on the most recent Mortgage that was taken out on this home.
Original Mortgage
$506,349
Interest Rate
6.88%
Mortgage Type
Seller Take Back
Purchase Details
Closed on
Jan 29, 1996
Sold by
Desoto Frank P and Desoto Kathleen R
Bought by
Pogge Phillip G and Pogge Oralia S
Home Financials for this Owner
Home Financials are based on the most recent Mortgage that was taken out on this home.
Original Mortgage
$120,156
Interest Rate
7.18%
Mortgage Type
Assumption
Create a Home Valuation Report for This Property
The Home Valuation Report is an in-depth analysis detailing your home's value as well as a comparison with similar homes in the area
Home Values in the Area
Average Home Value in this Area
Purchase History
| Date | Buyer | Sale Price | Title Company |
|---|---|---|---|
| Belangdal Nicandro | -- | Metro National Title | |
| Belangdal Nicandro | -- | Metro National Title | |
| Gmw Development Inc | -- | Bonneville Title Company Inc | |
| Pogge Phillip G | -- | Founders Title Co |
Source: Public Records
Mortgage History
| Date | Status | Borrower | Loan Amount |
|---|---|---|---|
| Previous Owner | Gmw Development Inc | $506,349 | |
| Previous Owner | Pogge Phillip G | $120,156 |
Source: Public Records
Tax History Compared to Growth
Tax History
| Year | Tax Paid | Tax Assessment Tax Assessment Total Assessment is a certain percentage of the fair market value that is determined by local assessors to be the total taxable value of land and additions on the property. | Land | Improvement |
|---|---|---|---|---|
| 2025 | $2,620 | $275,000 | $175,967 | $99,033 |
| 2024 | $2,575 | $272,250 | $171,184 | $101,066 |
| 2023 | $2,323 | $433,000 | $274,570 | $158,430 |
| 2022 | $2,494 | $252,450 | $129,735 | $122,715 |
| 2021 | $2,319 | $350,000 | $194,362 | $155,638 |
| 2020 | $2,106 | $305,000 | $173,814 | $131,186 |
| 2019 | $2,101 | $298,000 | $153,352 | $144,648 |
| 2018 | $1,861 | $265,000 | $137,102 | $127,898 |
| 2016 | $933 | $119,185 | $67,288 | $51,897 |
| 2015 | $1,611 | $112,310 | $67,288 | $45,022 |
| 2014 | $855 | $110,610 | $67,288 | $43,322 |
| 2013 | -- | $98,422 | $53,085 | $45,337 |
Source: Public Records
Map
Nearby Homes