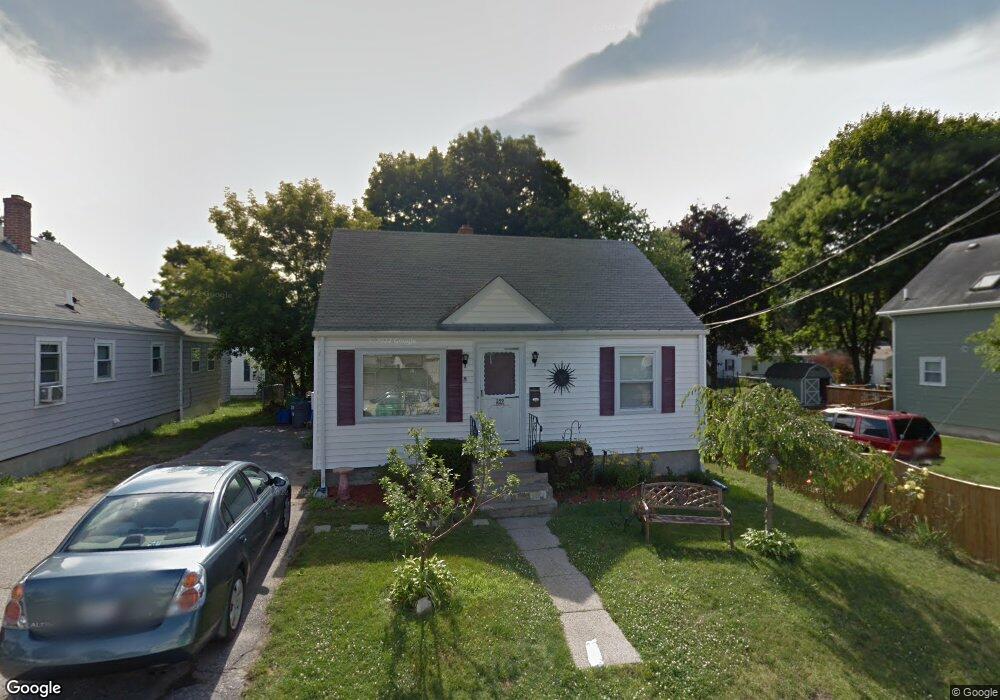
359 Bryant St Cumberland, RI 02864
Valley Falls NeighborhoodEstimated Value: $416,492 - $455,000
4
Beds
1
Bath
1,525
Sq Ft
$285/Sq Ft
Est. Value
About This Home
This home is located at 359 Bryant St, Cumberland, RI 02864 and is currently estimated at $435,373, approximately $285 per square foot. 359 Bryant St is a home located in Providence County with nearby schools including B.F. Norton Elementary School, Joseph L. McCourt Middle School, and Cumberland High School.
Ownership History
Date
Name
Owned For
Owner Type
Purchase Details
Closed on
Jun 28, 2006
Sold by
Welch-Chung Bonnie
Bought by
Bartley Pamela J and Bartley Jeffrey D
Current Estimated Value
Purchase Details
Closed on
Jan 30, 2002
Sold by
Clarke Catherine A
Bought by
Welch-Chung Bonnie and Welch Penny E
Create a Home Valuation Report for This Property
The Home Valuation Report is an in-depth analysis detailing your home's value as well as a comparison with similar homes in the area
Home Values in the Area
Average Home Value in this Area
Purchase History
We collect this data history from publicly available records. To have your information removed, we recommend requesting removal directly through your county’s website.
| Date | Buyer | Sale Price | Title Company |
|---|---|---|---|
| Bartley Pamela J | $257,000 | -- | |
| Welch-Chung Bonnie | $125,000 | -- |
Source: Public Records
Mortgage History
We collect this data history from publicly available records. To have your information removed, we recommend requesting removal directly through your county’s website.
| Date | Status | Borrower | Loan Amount |
|---|---|---|---|
| Open | Welch-Chung Bonnie | $279,053 | |
| Closed | Welch-Chung Bonnie | $274,930 |
Source: Public Records
Tax History
| Year | Tax Paid | Tax Assessment Tax Assessment Total Assessment is a certain percentage of the fair market value that is determined by local assessors to be the total taxable value of land and additions on the property. | Land | Improvement |
|---|---|---|---|---|
| 2025 | $3,321 | $270,700 | $125,400 | $145,300 |
| 2024 | $3,235 | $270,700 | $125,400 | $145,300 |
| 2023 | $3,146 | $270,700 | $125,400 | $145,300 |
| 2022 | $3,011 | $200,900 | $87,700 | $113,200 |
| 2021 | $2,961 | $200,900 | $87,700 | $113,200 |
| 2020 | $2,877 | $200,900 | $87,700 | $113,200 |
| 2019 | $2,790 | $175,700 | $73,300 | $102,400 |
| 2018 | $2,709 | $175,700 | $73,300 | $102,400 |
| 2017 | $2,672 | $175,700 | $73,300 | $102,400 |
| 2016 | $2,468 | $144,500 | $64,700 | $79,800 |
| 2015 | $2,468 | $144,500 | $64,700 | $79,800 |
| 2014 | $2,468 | $144,500 | $64,700 | $79,800 |
| 2013 | $2,697 | $170,900 | $65,700 | $105,200 |
Source: Public Records
Map
Nearby Homes
Your Personal Tour Guide
Ask me questions while you tour the home.