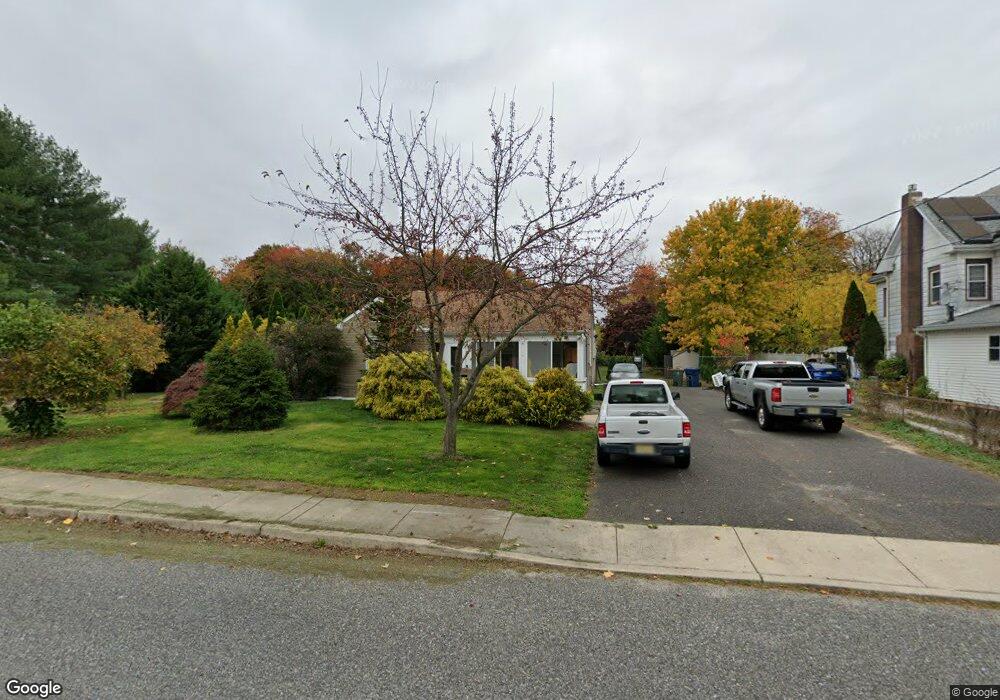
359 Chestnut St Williamstown, NJ 08094
Estimated Value: $259,922 - $297,000
--
Bed
--
Bath
1,138
Sq Ft
$246/Sq Ft
Est. Value
About This Home
This home is located at 359 Chestnut St, Williamstown, NJ 08094 and is currently estimated at $280,231, approximately $246 per square foot. 359 Chestnut St is a home located in Gloucester County with nearby schools including Williamstown High School, St. Mary School, and Finest of the Wheat Christian.
Ownership History
Date
Name
Owned For
Owner Type
Purchase Details
Closed on
Aug 28, 2000
Sold by
Conover Jack R
Bought by
Martin Thomas M and Martin Gabrielle A
Current Estimated Value
Home Financials for this Owner
Home Financials are based on the most recent Mortgage that was taken out on this home.
Original Mortgage
$93,762
Outstanding Balance
$34,173
Interest Rate
8.1%
Mortgage Type
Purchase Money Mortgage
Estimated Equity
$246,058
Purchase Details
Closed on
Aug 27, 1998
Sold by
Adams John M and Estate Of John J Adams
Bought by
Conover Jack R
Home Financials for this Owner
Home Financials are based on the most recent Mortgage that was taken out on this home.
Original Mortgage
$84,663
Interest Rate
6.9%
Mortgage Type
FHA
Create a Home Valuation Report for This Property
The Home Valuation Report is an in-depth analysis detailing your home's value as well as a comparison with similar homes in the area
Home Values in the Area
Average Home Value in this Area
Purchase History
| Date | Buyer | Sale Price | Title Company |
|---|---|---|---|
| Martin Thomas M | $95,000 | -- | |
| Conover Jack R | $84,900 | Surety Title Corporation |
Source: Public Records
Mortgage History
| Date | Status | Borrower | Loan Amount |
|---|---|---|---|
| Open | Martin Thomas M | $93,762 | |
| Previous Owner | Conover Jack R | $84,663 |
Source: Public Records
Tax History Compared to Growth
Tax History
| Year | Tax Paid | Tax Assessment Tax Assessment Total Assessment is a certain percentage of the fair market value that is determined by local assessors to be the total taxable value of land and additions on the property. | Land | Improvement |
|---|---|---|---|---|
| 2025 | $5,156 | $140,800 | $50,100 | $90,700 |
| 2024 | $5,118 | $140,800 | $50,100 | $90,700 |
| 2023 | $5,118 | $140,800 | $50,100 | $90,700 |
| 2022 | $5,094 | $140,800 | $50,100 | $90,700 |
| 2021 | $5,127 | $140,800 | $50,100 | $90,700 |
| 2020 | $5,121 | $140,800 | $50,100 | $90,700 |
| 2019 | $5,090 | $140,800 | $50,100 | $90,700 |
| 2018 | $5,007 | $140,800 | $50,100 | $90,700 |
| 2017 | $5,108 | $144,200 | $49,700 | $94,500 |
| 2016 | $5,043 | $144,200 | $49,700 | $94,500 |
| 2015 | $4,898 | $144,200 | $49,700 | $94,500 |
| 2014 | $4,756 | $144,200 | $49,700 | $94,500 |
Source: Public Records
Map
Nearby Homes
- 30 Tool Ln
- 308 Oak St
- 221 Oak St
- 112 Shisler Ave
- 520 S Main St
- 354 S Main St
- 18 Bodine Ave
- 647 Chestnut St
- 549 Maidstone Dr
- 934 N Beecham Rd
- 640 Ironwood Dr
- 632 Clayton Rd
- 13 S Main St
- 1361 Black Horse Pike
- 109 Poplar St
- 304 Thackeray Ln
- 1008 London Cir
- 1017 Micawber Dr
- 1011 S Beecham Rd
- 959 S Main St
- 351 Chestnut St
- 349 Chestnut St
- 343 Chestnut St
- 404 Chestnut St
- 341 Chestnut St
- 335 Chestnut St
- 10 Tool Ln
- 333 Chestnut St
- 328 Chestnut St
- 327 Chestnut St
- 336 Oak St
- 33 Marion Ave
- 326 Chestnut St
- 418 Chestnut St
- 419 Chestnut St
- 31 Marion Ave
- 316 Oak St
- 319 Chestnut St
- 324 Chestnut St
- 445 Chestnut St