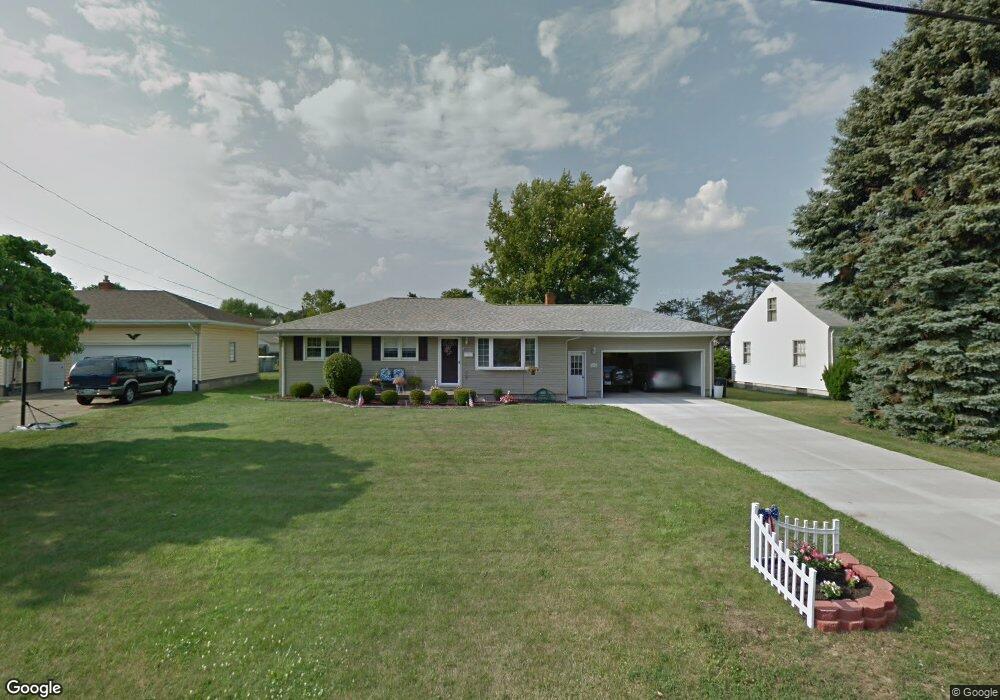
359 Como St Struthers, OH 44471
Estimated Value: $146,464 - $179,000
3
Beds
2
Baths
1,040
Sq Ft
$152/Sq Ft
Est. Value
About This Home
This home is located at 359 Como St, Struthers, OH 44471 and is currently estimated at $158,116, approximately $152 per square foot. 359 Como St is a home located in Mahoning County with nearby schools including Struthers Elementary School, Struthers Middle School, and Struthers High School.
Ownership History
Date
Name
Owned For
Owner Type
Purchase Details
Closed on
Jun 29, 2010
Sold by
Firmstone Michael A
Bought by
Norris Donald A and Febinger Nancy A
Current Estimated Value
Home Financials for this Owner
Home Financials are based on the most recent Mortgage that was taken out on this home.
Original Mortgage
$8,000
Outstanding Balance
$5,225
Interest Rate
4.77%
Mortgage Type
Seller Take Back
Estimated Equity
$152,891
Purchase Details
Closed on
Aug 13, 2001
Sold by
Firmstone Donna M
Bought by
Firmstone Michael A
Home Financials for this Owner
Home Financials are based on the most recent Mortgage that was taken out on this home.
Original Mortgage
$65,800
Outstanding Balance
$24,726
Interest Rate
7.28%
Estimated Equity
$133,390
Purchase Details
Closed on
Feb 21, 1986
Bought by
Firmstone Michael A
Create a Home Valuation Report for This Property
The Home Valuation Report is an in-depth analysis detailing your home's value as well as a comparison with similar homes in the area
Home Values in the Area
Average Home Value in this Area
Purchase History
| Date | Buyer | Sale Price | Title Company |
|---|---|---|---|
| Norris Donald A | $79,000 | Attorney | |
| Firmstone Michael A | $77,500 | -- | |
| Firmstone Michael A | -- | -- |
Source: Public Records
Mortgage History
| Date | Status | Borrower | Loan Amount |
|---|---|---|---|
| Open | Norris Donald A | $8,000 | |
| Open | Firmstone Michael A | $65,800 | |
| Closed | Firmstone Michael A | $11,700 |
Source: Public Records
Tax History
| Year | Tax Paid | Tax Assessment Tax Assessment Total Assessment is a certain percentage of the fair market value that is determined by local assessors to be the total taxable value of land and additions on the property. | Land | Improvement |
|---|---|---|---|---|
| 2025 | $1,085 | $36,200 | $2,730 | $33,470 |
| 2024 | $1,100 | $36,200 | $2,730 | $33,470 |
| 2023 | $1,107 | $36,200 | $2,730 | $33,470 |
| 2022 | $739 | $22,400 | $2,570 | $19,830 |
| 2021 | $733 | $22,400 | $2,570 | $19,830 |
| 2020 | $736 | $22,400 | $2,570 | $19,830 |
| 2019 | $640 | $19,490 | $2,240 | $17,250 |
| 2018 | $610 | $19,490 | $2,240 | $17,250 |
| 2017 | $686 | $19,490 | $2,240 | $17,250 |
| 2016 | $765 | $22,610 | $2,610 | $20,000 |
| 2015 | $747 | $22,610 | $2,610 | $20,000 |
| 2014 | $750 | $22,610 | $2,610 | $20,000 |
| 2013 | $697 | $22,610 | $2,610 | $20,000 |
Source: Public Records
Map
Nearby Homes
Your Personal Tour Guide
Ask me questions while you tour the home.