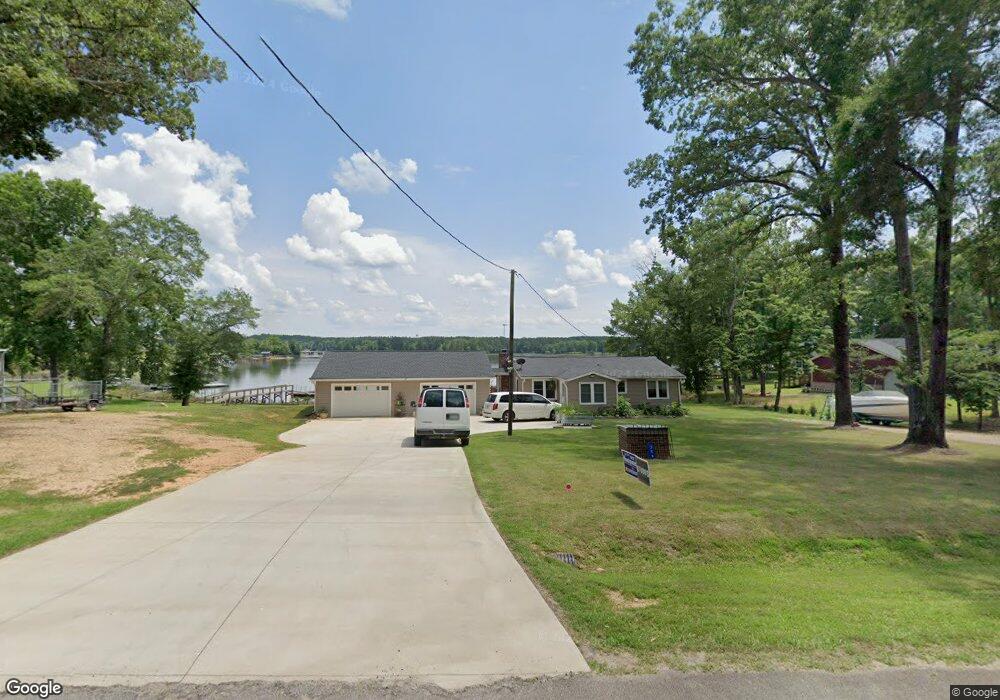
359 Dutchman Ln Unit 25 Winnsboro, SC 29180
Estimated Value: $341,801 - $435,000
3
Beds
3
Baths
1,216
Sq Ft
$321/Sq Ft
Est. Value
About This Home
This home is located at 359 Dutchman Ln Unit 25, Winnsboro, SC 29180 and is currently estimated at $390,200, approximately $320 per square foot. 359 Dutchman Ln Unit 25 is a home located in Fairfield County with nearby schools including Fairfield Middle School and Fairfield Central High School.
Ownership History
Date
Name
Owned For
Owner Type
Purchase Details
Closed on
Jul 9, 2024
Sold by
Montgomery Timothy D and Montgomery Linda D
Bought by
Timothy D Montgomery And Linda D Montgomery R and Montgomery
Current Estimated Value
Purchase Details
Closed on
Jan 23, 2019
Sold by
Brown Coley and Carlson Annette
Bought by
Montgomery Timothy and Montgomery Linda
Home Financials for this Owner
Home Financials are based on the most recent Mortgage that was taken out on this home.
Original Mortgage
$191,250
Interest Rate
4.6%
Mortgage Type
New Conventional
Purchase Details
Closed on
Dec 11, 2017
Sold by
Brown Coley
Bought by
Carlson Annette
Purchase Details
Closed on
Feb 9, 2016
Sold by
Magill Margie S and Magill Herman Mackey
Bought by
Brown Coley
Purchase Details
Closed on
Aug 14, 2014
Sold by
Estate Of James Herman Magill
Bought by
Magill Margie S and Magill Herman Mackey
Create a Home Valuation Report for This Property
The Home Valuation Report is an in-depth analysis detailing your home's value as well as a comparison with similar homes in the area
Home Values in the Area
Average Home Value in this Area
Purchase History
| Date | Buyer | Sale Price | Title Company |
|---|---|---|---|
| Timothy D Montgomery And Linda D Montgomery R | -- | None Listed On Document | |
| Montgomery Timothy | $225,000 | -- | |
| Carlson Annette | -- | -- | |
| Brown Coley | $150,000 | -- | |
| Brown Coley | $150,000 | None Available | |
| Magill Margie S | -- | -- |
Source: Public Records
Mortgage History
| Date | Status | Borrower | Loan Amount |
|---|---|---|---|
| Previous Owner | Montgomery Timothy | $191,250 |
Source: Public Records
Tax History Compared to Growth
Tax History
| Year | Tax Paid | Tax Assessment Tax Assessment Total Assessment is a certain percentage of the fair market value that is determined by local assessors to be the total taxable value of land and additions on the property. | Land | Improvement |
|---|---|---|---|---|
| 2024 | $1,457 | $8,552 | $6,000 | $2,552 |
| 2023 | $1,179 | $8,552 | $6,000 | $2,552 |
| 2022 | $1,101 | $8,552 | $6,000 | $2,552 |
| 2021 | $1,105 | $8,552 | $6,000 | $2,552 |
| 2020 | $5,006 | $8,552 | $6,000 | $2,552 |
| 2019 | $1,076 | $5,992 | $4,600 | $1,392 |
| 2018 | $1,055 | $5,992 | $4,600 | $1,392 |
| 2017 | $3,463 | $8,988 | $0 | $0 |
| 2016 | $3,911 | $8,988 | $0 | $0 |
| 2015 | $5,318 | $0 | $0 | $0 |
| 2014 | $5,318 | $13,683 | $0 | $0 |
| 2012 | $5,318 | $13,683 | $0 | $0 |
Source: Public Records
Map
Nearby Homes
- 49 Club Ln
- 4472 River Rd
- 1595 State Road S-20-317
- 1273 Wateree Estates Rd
- 242 Morninglow Dr Unit 146
- 1720 Deer Run Rd
- 64 Rion Cir
- 275 S Waters Edge Dr
- 3541 Deer Run Rd
- 143 Westshore Dr
- 2429 Singleton Point
- 2298 Singleton Creek Rd
- 2242 Singleton Creek Rd
- 331 Westshore Dr
- 1403 Westshore Dr
- 639 Kingfisher Dr
- 0 Woodside Dr
- Lot A Lazy Ln Unit A
- 62 Lazy Ln Unit 301
- Lot C Lazy Ln
- 325 Dutchman Ln
- 375 Dutchman Ln Unit 27
- 387 Dutchman Ln Unit 28
- 213 Dutchman Ln
- 397 Dutchman Ln
- 187 Dutchman Ln
- 457 Dutchman Ln
- 75 Dutchman Ln
- 18 Palmetto Place Ln Unit 11
- 26 Palmetto Place Ln Unit 10
- 473 Dutchman Ln
- 477 Dutchman Ln Unit 33
- 38 Palmetto Place Ln Unit 9
- 10 Palmetto Place Ln Unit 12
- 50 Palmetto Place Ln Unit 8
- 62 Palmetto Place Ln Unit 7
- 483 Dutchman Ln Unit 34
- 163 Wateree Estates Rd
- 243 Wateree Estates Rd
- 74 Palmetto Place Ln Unit 6