Estimated Value: $255,000 - $322,000
4
Beds
2
Baths
2,640
Sq Ft
$106/Sq Ft
Est. Value
About This Home
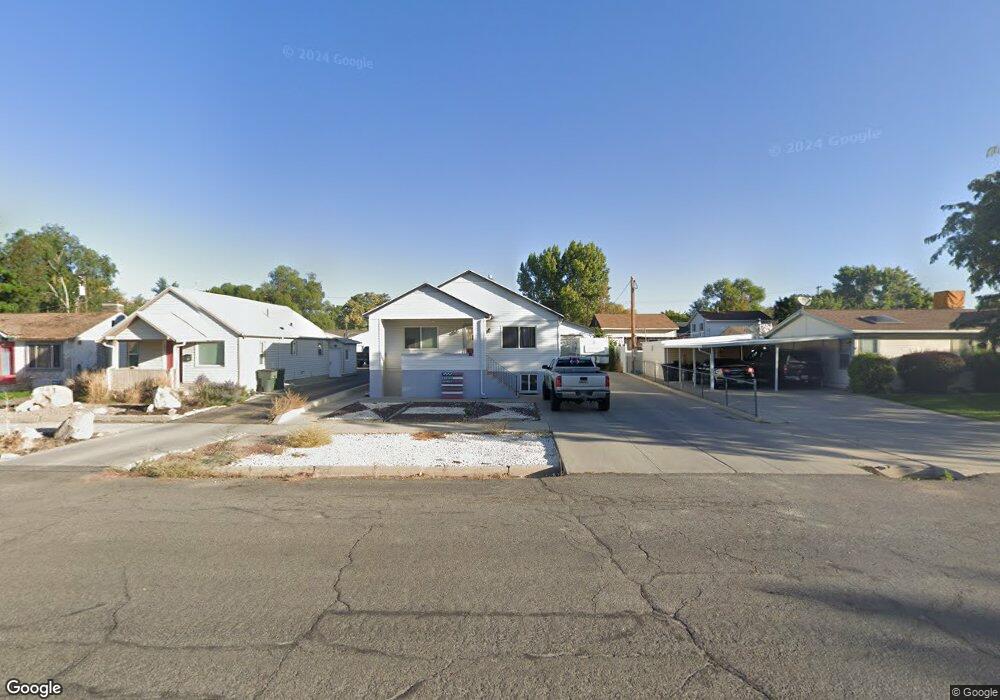
This home is located at 359 E 200 N, Price, UT 84501 and is currently estimated at $279,398, approximately $105 per square foot. 359 E 200 N is a home located in Carbon County with nearby schools including Castle Heights School, Mont Harmon Junior High School, and Carbon High School.
Ownership History
Date
Name
Owned For
Owner Type
Purchase Details
Closed on
Oct 27, 2016
Sold by
Miller Janice A
Bought by
Miller Janice A and Evans Michael Robert
Current Estimated Value
Purchase Details
Closed on
Oct 23, 2013
Sold by
Desimone Renee A and Simone Renee A
Bought by
Desimone Renee A and Miller Janice A
Purchase Details
Closed on
Sep 15, 2009
Sold by
Desimone Emil and Desimone Renee A
Bought by
Desimone Emil and Desimone Renee A
Create a Home Valuation Report for This Property
The Home Valuation Report is an in-depth analysis detailing your home's value as well as a comparison with similar homes in the area
Purchase History
| Date | Buyer | Sale Price | Title Company |
|---|---|---|---|
| Miller Janice A | -- | South Easterin Utah Title Co | |
| Desimone Renee A | -- | South Eastern Utah Title Co | |
| Desimone Emil | -- | South Eastern Utah Title Co |
Source: Public Records
Tax History
| Year | Tax Paid | Tax Assessment Tax Assessment Total Assessment is a certain percentage of the fair market value that is determined by local assessors to be the total taxable value of land and additions on the property. | Land | Improvement |
|---|---|---|---|---|
| 2025 | $1,223 | $100,652 | $18,149 | $82,503 |
| 2024 | $1,562 | $130,053 | $15,180 | $114,873 |
| 2023 | $1,472 | $130,691 | $10,960 | $119,731 |
| 2022 | $1,539 | $122,597 | $9,112 | $113,484 |
| 2021 | $1,322 | $163,441 | $13,923 | $149,518 |
| 2020 | $1,297 | $80,443 | $0 | $0 |
| 2019 | $1,153 | $75,014 | $0 | $0 |
| 2018 | $981 | $65,098 | $0 | $0 |
| 2017 | $969 | $65,098 | $0 | $0 |
| 2016 | $874 | $65,098 | $0 | $0 |
| 2015 | $874 | $65,098 | $0 | $0 |
| 2014 | $868 | $65,098 | $0 | $0 |
| 2013 | $894 | $66,398 | $0 | $0 |
Source: Public Records
Map
Nearby Homes
Your Personal Tour Guide
Ask me questions while you tour the home.