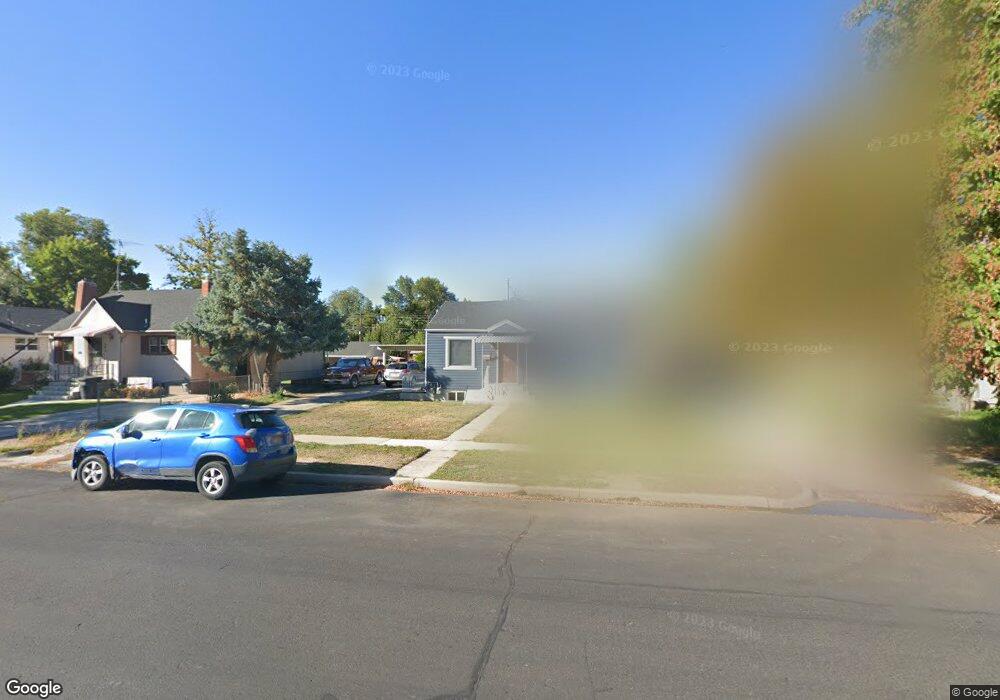
359 E 400 S Provo, UT 84606
Provost NeighborhoodEstimated Value: $444,000 - $510,000
4
Beds
2
Baths
1,458
Sq Ft
$326/Sq Ft
Est. Value
About This Home
This home is located at 359 E 400 S, Provo, UT 84606 and is currently estimated at $475,795, approximately $326 per square foot. 359 E 400 S is a home located in Utah County with nearby schools including Provo Peaks School, Centennial Middle School, and Timpview High School.
Ownership History
Date
Name
Owned For
Owner Type
Purchase Details
Closed on
May 15, 2015
Sold by
Bird Nicholas
Bought by
Chang Hung Che and Chang Li
Current Estimated Value
Purchase Details
Closed on
Sep 26, 2011
Sold by
Bird Nicholas
Bought by
Bird Nicholas
Home Financials for this Owner
Home Financials are based on the most recent Mortgage that was taken out on this home.
Original Mortgage
$169,915
Interest Rate
3.75%
Mortgage Type
FHA
Purchase Details
Closed on
Aug 27, 2008
Sold by
Manwaring Wayne L and Manwaring Christine
Bought by
Bird Nicholas
Home Financials for this Owner
Home Financials are based on the most recent Mortgage that was taken out on this home.
Original Mortgage
$172,854
Interest Rate
6.27%
Mortgage Type
FHA
Create a Home Valuation Report for This Property
The Home Valuation Report is an in-depth analysis detailing your home's value as well as a comparison with similar homes in the area
Home Values in the Area
Average Home Value in this Area
Purchase History
| Date | Buyer | Sale Price | Title Company |
|---|---|---|---|
| Chang Hung Che | -- | First American | |
| Bird Nicholas | -- | Metro National Title | |
| Bird Nicholas | -- | Metro National Title | |
| Bird Nicholas | -- | Equity Title Insurance Agen |
Source: Public Records
Mortgage History
| Date | Status | Borrower | Loan Amount |
|---|---|---|---|
| Previous Owner | Bird Nicholas | $169,915 | |
| Previous Owner | Bird Nicholas | $172,854 |
Source: Public Records
Tax History
| Year | Tax Paid | Tax Assessment Tax Assessment Total Assessment is a certain percentage of the fair market value that is determined by local assessors to be the total taxable value of land and additions on the property. | Land | Improvement |
|---|---|---|---|---|
| 2025 | $2,458 | $243,980 | -- | -- |
| 2024 | $2,458 | $241,945 | $0 | $0 |
| 2023 | $2,468 | $239,525 | $0 | $0 |
| 2022 | $2,332 | $228,140 | $0 | $0 |
| 2021 | $1,944 | $331,800 | $132,700 | $199,100 |
| 2020 | $1,852 | $296,300 | $118,500 | $177,800 |
| 2019 | $1,656 | $275,600 | $120,700 | $154,900 |
| 2018 | $1,501 | $253,300 | $172,400 | $80,900 |
| 2017 | $1,357 | $125,840 | $0 | $0 |
| 2016 | $1,223 | $105,710 | $0 | $0 |
| 2015 | $1,100 | $96,085 | $0 | $0 |
| 2014 | $917 | $83,545 | $0 | $0 |
Source: Public Records
Map
Nearby Homes
Your Personal Tour Guide
Ask me questions while you tour the home.