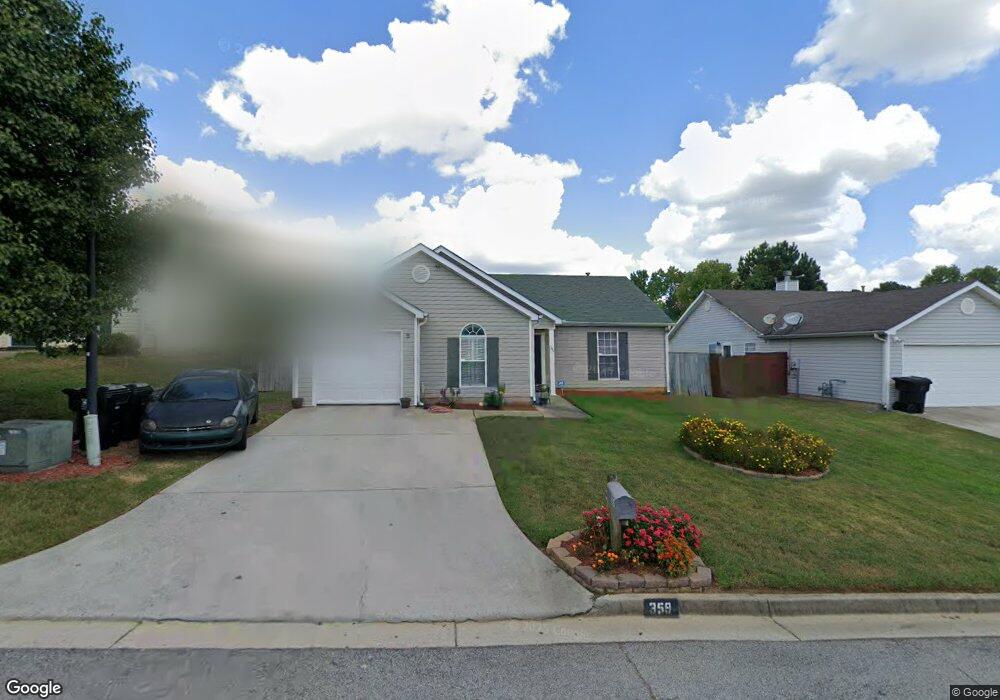
359 Eagles Crossing Cir Unit 2 Riverdale, GA 30274
Estimated Value: $227,860 - $265,000
3
Beds
2
Baths
1,408
Sq Ft
$171/Sq Ft
Est. Value
About This Home
This home is located at 359 Eagles Crossing Cir Unit 2, Riverdale, GA 30274 and is currently estimated at $241,465, approximately $171 per square foot. 359 Eagles Crossing Cir Unit 2 is a home located in Clayton County with nearby schools including Riverdale Elementary School, Sequoyah Middle School, and Charles R. Drew High School.
Ownership History
Date
Name
Owned For
Owner Type
Purchase Details
Closed on
Oct 19, 2006
Sold by
Copeland Marvin
Bought by
Copeland Valerie
Current Estimated Value
Home Financials for this Owner
Home Financials are based on the most recent Mortgage that was taken out on this home.
Original Mortgage
$122,500
Outstanding Balance
$81,696
Interest Rate
8.7%
Mortgage Type
New Conventional
Estimated Equity
$159,769
Purchase Details
Closed on
Jan 1, 2005
Sold by
Monroe Crystal L
Bought by
Copeland Mervin
Purchase Details
Closed on
Nov 15, 2000
Sold by
Gt Architecture Contractors Corp
Bought by
Monroe Crystal
Home Financials for this Owner
Home Financials are based on the most recent Mortgage that was taken out on this home.
Original Mortgage
$96,133
Interest Rate
7.87%
Mortgage Type
FHA
Create a Home Valuation Report for This Property
The Home Valuation Report is an in-depth analysis detailing your home's value as well as a comparison with similar homes in the area
Home Values in the Area
Average Home Value in this Area
Purchase History
| Date | Buyer | Sale Price | Title Company |
|---|---|---|---|
| Copeland Valerie | $122,500 | -- | |
| Copeland Mervin | $112,600 | -- | |
| Monroe Crystal | $92,000 | -- |
Source: Public Records
Mortgage History
| Date | Status | Borrower | Loan Amount |
|---|---|---|---|
| Open | Copeland Valerie | $122,500 | |
| Previous Owner | Monroe Crystal | $96,133 |
Source: Public Records
Tax History Compared to Growth
Tax History
| Year | Tax Paid | Tax Assessment Tax Assessment Total Assessment is a certain percentage of the fair market value that is determined by local assessors to be the total taxable value of land and additions on the property. | Land | Improvement |
|---|---|---|---|---|
| 2024 | $3,744 | $95,000 | $8,000 | $87,000 |
| 2023 | $3,338 | $92,440 | $8,000 | $84,440 |
| 2022 | $2,694 | $67,680 | $8,000 | $59,680 |
| 2021 | $2,106 | $52,360 | $8,000 | $44,360 |
| 2020 | $1,852 | $45,364 | $8,000 | $37,364 |
| 2019 | $1,757 | $42,332 | $6,400 | $35,932 |
| 2018 | $1,603 | $38,560 | $6,400 | $32,160 |
| 2017 | $1,240 | $29,531 | $6,400 | $23,131 |
| 2016 | $1,120 | $26,587 | $6,400 | $20,187 |
| 2015 | $1,110 | $0 | $0 | $0 |
| 2014 | $764 | $18,242 | $6,400 | $11,842 |
Source: Public Records
Map
Nearby Homes
- 425 Eagles Flight Ln
- 416 Eagles Flight Ln
- 6127 Pinegrove Rd
- 6501 River Run Rd Unit 3
- 807 Boston Common
- 545 Oak Valley Dr
- 834 Pine Shoals Ct
- 222 Roy Huie Rd
- 6332 Valley Dale Dr
- 6372 Valley Dale Dr
- 556 Roy Huie Rd
- 5517 Rock Shoals Way
- 172 Scarsdale Dr
- 5582 Windwood Rd
- 149 Roy Huie Rd
- 742 Verde Dr
- 6371 Westbury Rd
- 5591 Windwood Rd Unit 2
- 6377 Westbury Rd
- 365 Eagles Crossing Cir
- 353 Eagles Crossing Cir
- 5742 Eagles Feather Ln Unit 2
- 5736 Eagles Feather Ln
- 371 Eagles Crossing Cir Unit 2
- 5748 Eagles Feather Ln Unit 2
- 5724 Eagles Feather Ln Unit 2
- 5724 Eagles Feather Ln
- 5708 Eagles Feather Ln Unit 5708
- 5708 Eagles Feather Ln
- 362 Eagles Crossing Cir
- 5700 Eagles Feather Ln
- 5684 Eagles Feather Ln
- 5754 Eagles Feather Ln
- 368 Eagles Crossing Cir Unit 2
- 377 Eagles Crossing Cir
- 374 Eagles Crossing Cir
- 5678 Eagles Feather Ln Unit 2
- 5760 Eagles Feather Ln Unit 2
- 383 Eagles Crossing Cir Unit 2