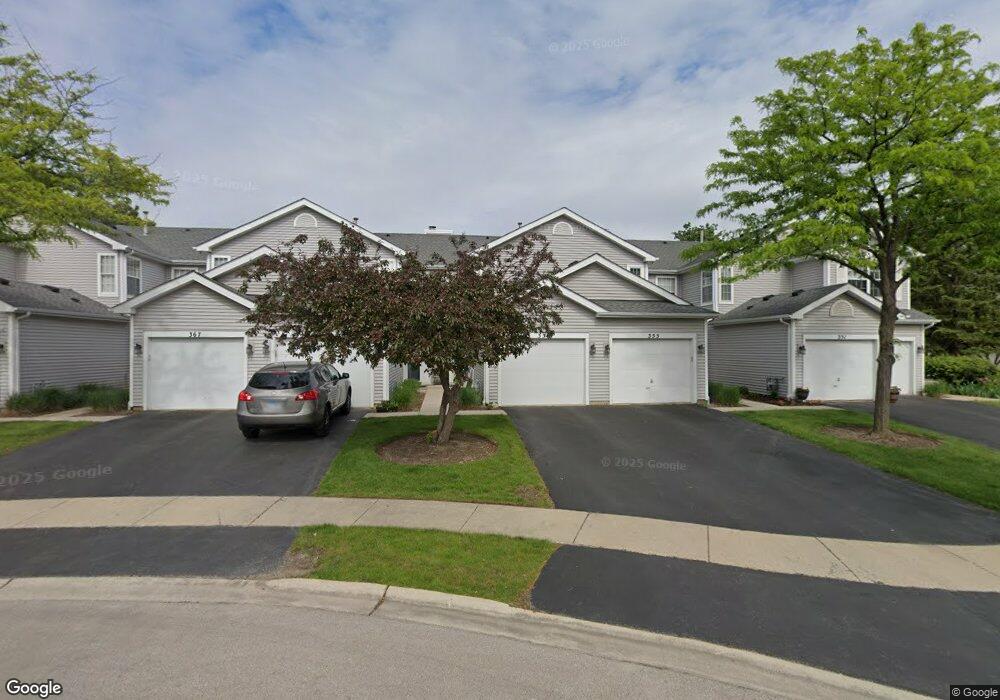
359 Fallbrook Ct Unit 16359A Schaumburg, IL 60194
West Schaumburg NeighborhoodEstimated Value: $263,954 - $313,000
2
Beds
--
Bath
1,200
Sq Ft
$250/Sq Ft
Est. Value
About This Home
This home is located at 359 Fallbrook Ct Unit 16359A, Schaumburg, IL 60194 and is currently estimated at $300,239, approximately $250 per square foot. 359 Fallbrook Ct Unit 16359A is a home located in Cook County with nearby schools including Glenbrook Elementary School, Canton Middle School, and Streamwood High School.
Ownership History
Date
Name
Owned For
Owner Type
Purchase Details
Closed on
Nov 21, 2002
Sold by
Nichols Judy P
Bought by
Nichols Judy P and Park Matthew S
Current Estimated Value
Purchase Details
Closed on
Dec 10, 2001
Sold by
Bae Kelley Jin
Bought by
Nichols Judy P
Home Financials for this Owner
Home Financials are based on the most recent Mortgage that was taken out on this home.
Original Mortgage
$100,000
Outstanding Balance
$38,959
Interest Rate
6.53%
Estimated Equity
$261,280
Purchase Details
Closed on
May 23, 2001
Sold by
Suo Bae Kelly Jin and Suo Jung
Bought by
Bae Kelley Jin
Home Financials for this Owner
Home Financials are based on the most recent Mortgage that was taken out on this home.
Original Mortgage
$122,500
Interest Rate
7.18%
Purchase Details
Closed on
Jan 25, 1999
Sold by
Draus Christopher P
Bought by
Sun Bae Kelley Jin and Sun Jun Chang
Home Financials for this Owner
Home Financials are based on the most recent Mortgage that was taken out on this home.
Original Mortgage
$122,750
Interest Rate
6.92%
Mortgage Type
FHA
Create a Home Valuation Report for This Property
The Home Valuation Report is an in-depth analysis detailing your home's value as well as a comparison with similar homes in the area
Home Values in the Area
Average Home Value in this Area
Purchase History
| Date | Buyer | Sale Price | Title Company |
|---|---|---|---|
| Nichols Judy P | -- | -- | |
| Nichols Judy P | $166,000 | -- | |
| Bae Kelley Jin | -- | -- | |
| Sun Bae Kelley Jin | $127,000 | -- |
Source: Public Records
Mortgage History
| Date | Status | Borrower | Loan Amount |
|---|---|---|---|
| Open | Nichols Judy P | $100,000 | |
| Previous Owner | Bae Kelley Jin | $122,500 | |
| Previous Owner | Sun Bae Kelley Jin | $122,750 |
Source: Public Records
Tax History Compared to Growth
Tax History
| Year | Tax Paid | Tax Assessment Tax Assessment Total Assessment is a certain percentage of the fair market value that is determined by local assessors to be the total taxable value of land and additions on the property. | Land | Improvement |
|---|---|---|---|---|
| 2024 | $1,512 | $20,295 | $2,535 | $17,760 |
| 2023 | $1,525 | $20,295 | $2,535 | $17,760 |
| 2022 | $1,525 | $20,295 | $2,535 | $17,760 |
| 2021 | $1,775 | $15,976 | $3,090 | $12,886 |
| 2020 | $1,633 | $15,976 | $3,090 | $12,886 |
| 2019 | $1,617 | $17,914 | $3,090 | $14,824 |
| 2018 | $1,791 | $13,164 | $2,693 | $10,471 |
| 2017 | $1,746 | $13,164 | $2,693 | $10,471 |
| 2016 | $2,371 | $13,164 | $2,693 | $10,471 |
| 2015 | $2,723 | $13,429 | $652 | $12,777 |
| 2014 | $2,634 | $13,429 | $652 | $12,777 |
| 2013 | $2,212 | $13,429 | $652 | $12,777 |
Source: Public Records
Map
Nearby Homes
- 368 Glen Byrn Ct Unit 11368A
- 2741 Odlum Dr Unit 3
- 226 Sierra Pass Dr Unit 62262
- 2933 Heatherwood Dr Unit 1915
- 247 Camel Bend Ct Unit 37247
- 239 Camel Bend Ct Unit 36239
- 217 Sierra Pass Dr Unit 28217
- 171 Sierra Pass Dr Unit 261713
- 2 Oakmont Ct
- 208 Judy Ln
- 62 Beechmont Ct Unit C
- 216 Whitewood Dr Unit 5
- 1968 Quaker Hollow Ln Unit 12
- 198 Camden Ct Unit Z2
- 311 W Kennedy Dr
- 2868 Belle Ln Unit 143B28
- 27 Ridge Cir
- 1924 Quaker Hollow Ln Unit 14
- 1916 Quaker Hollow Ln Unit 14
- 195 Island Ct
- 347 Fallbrook Ct Unit 16347B
- 363 Fallbrook Ct Unit 16363A
- 351 Fallbrook Ct Unit 16351A
- 367 Fallbrook Ct Unit 16367A
- 371 Fallbrook Ct Unit 16371A
- 355 Fallbrook Ct Unit 16355A
- 375 Fallbrook Ct Unit 16375B
- 376 Maidstone Ct Unit 15376B
- 376 Maidstone Ct Unit 376
- 384 Maidstone Ct Unit 14384A
- 384 Maidstone Ct Unit 14A
- 388 Maidstone Ct Unit 14388A
- 383 Fallbrook Ct Unit 17383A
- 380 Maidstone Ct Unit 14380B
- 380 Maidstone Ct Unit 380
- 379 Fallbrook Ct Unit 17379B
- 392 Maidstone Ct Unit 14392A
- 387 Fallbrook Ct Unit 17387A
- 348 Fallbrook Ct Unit 19348A
- 391 Fallbrook Ct