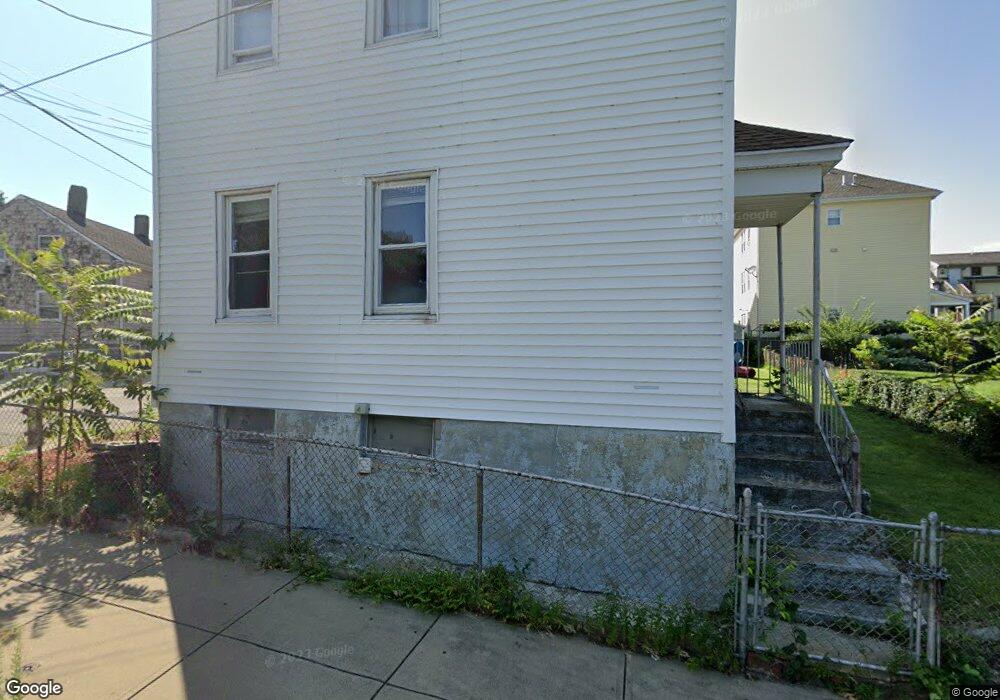
359 Hartwell St Fall River, MA 02721
Corky Row NeighborhoodEstimated Value: $393,000 - $592,000
6
Beds
2
Baths
2,544
Sq Ft
$199/Sq Ft
Est. Value
About This Home
This home is located at 359 Hartwell St, Fall River, MA 02721 and is currently estimated at $505,194, approximately $198 per square foot. 359 Hartwell St is a home located in Bristol County with nearby schools including Henry Lord Community School, B M C Durfee High School, and Argosy Collegiate Charter School.
Ownership History
Date
Name
Owned For
Owner Type
Purchase Details
Closed on
Mar 12, 2003
Sold by
Soares Jacinto Cabral
Bought by
Pacheco David M
Current Estimated Value
Home Financials for this Owner
Home Financials are based on the most recent Mortgage that was taken out on this home.
Original Mortgage
$166,000
Outstanding Balance
$71,676
Interest Rate
5.94%
Mortgage Type
Purchase Money Mortgage
Estimated Equity
$433,518
Create a Home Valuation Report for This Property
The Home Valuation Report is an in-depth analysis detailing your home's value as well as a comparison with similar homes in the area
Home Values in the Area
Average Home Value in this Area
Purchase History
| Date | Buyer | Sale Price | Title Company |
|---|---|---|---|
| Pacheco David M | $175,000 | -- |
Source: Public Records
Mortgage History
| Date | Status | Borrower | Loan Amount |
|---|---|---|---|
| Open | Pacheco David M | $166,000 |
Source: Public Records
Tax History
| Year | Tax Paid | Tax Assessment Tax Assessment Total Assessment is a certain percentage of the fair market value that is determined by local assessors to be the total taxable value of land and additions on the property. | Land | Improvement |
|---|---|---|---|---|
| 2025 | $4,903 | $428,200 | $102,100 | $326,100 |
| 2024 | $4,444 | $386,800 | $95,300 | $291,500 |
| 2023 | $4,053 | $330,300 | $80,000 | $250,300 |
| 2022 | $3,754 | $297,500 | $76,100 | $221,400 |
| 2021 | $3,354 | $242,500 | $72,900 | $169,600 |
| 2020 | $2,997 | $207,400 | $70,500 | $136,900 |
| 2019 | $2,881 | $197,600 | $70,500 | $127,100 |
| 2018 | $2,953 | $202,000 | $74,700 | $127,300 |
| 2017 | $2,733 | $195,200 | $74,700 | $120,500 |
| 2016 | $2,849 | $209,000 | $91,400 | $117,600 |
| 2015 | $2,688 | $205,500 | $87,900 | $117,600 |
| 2014 | $2,834 | $225,300 | $97,600 | $127,700 |
Source: Public Records
Map
Nearby Homes
- 347 Hartwell St
- 316 Morgan St
- 327 Morgan St
- 144 John St
- 377 Hartwell St
- 337 Hartwell St Unit 1 North
- 337 Hartwell St Unit 1 South
- 337 Hartwell St
- 154 John St
- 186 John St Unit 3S
- 198 John St
- 327 Hartwell St
- 387 Hartwell St
- 394 Hartwell St
- 122 John St
- 161 John St
- 397 Hartwell St
- 517 Plymouth Ave
- 208 John St Unit 210
- 137 John St Unit 3
Your Personal Tour Guide
Ask me questions while you tour the home.