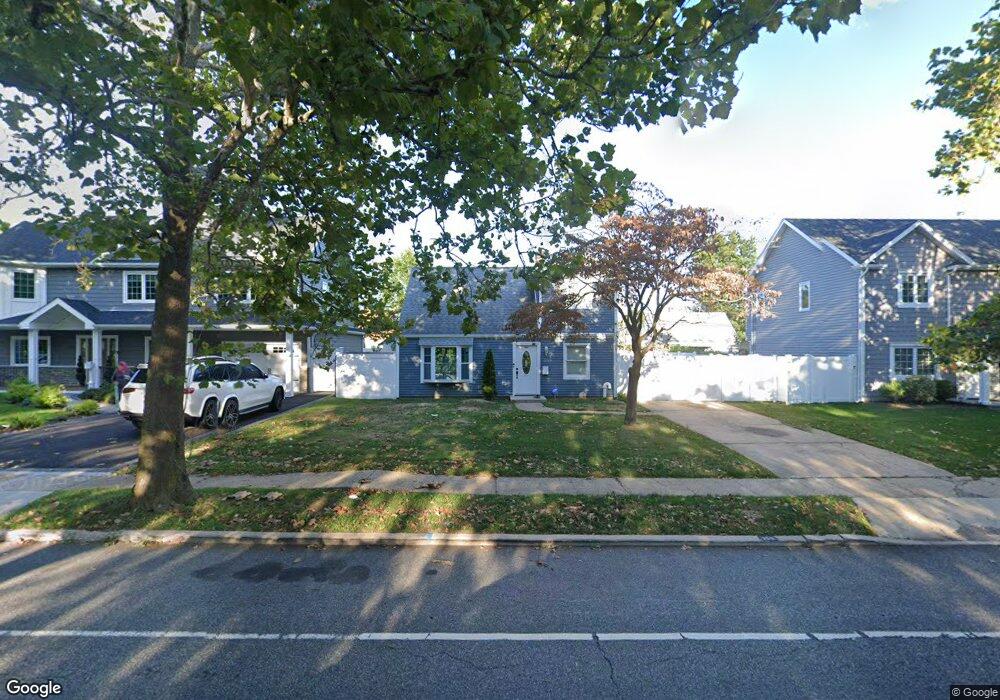
359 Loring Rd Levittown, NY 11756
Estimated Value: $645,724 - $661,000
3
Beds
2
Baths
1,125
Sq Ft
$581/Sq Ft
Est. Value
About This Home
This home is located at 359 Loring Rd, Levittown, NY 11756 and is currently estimated at $653,362, approximately $580 per square foot. 359 Loring Rd is a home located in Nassau County with nearby schools including Gardiners Avenue School, Jonas E. Salk Middle School, and Gen. Douglas MacArthur Senior High School.
Ownership History
Date
Name
Owned For
Owner Type
Purchase Details
Closed on
Jul 30, 2021
Sold by
Vargas Ilsa and Almonacid Giselle
Bought by
Abbey Maria
Current Estimated Value
Home Financials for this Owner
Home Financials are based on the most recent Mortgage that was taken out on this home.
Original Mortgage
$456,000
Outstanding Balance
$414,645
Interest Rate
2.9%
Mortgage Type
New Conventional
Estimated Equity
$238,717
Purchase Details
Closed on
Feb 8, 2021
Sold by
Rzonca Edward and Rzonca Edward
Bought by
Almonacid Gisselle Fernanda and Vargas Isla
Home Financials for this Owner
Home Financials are based on the most recent Mortgage that was taken out on this home.
Original Mortgage
$237,500
Interest Rate
2.7%
Mortgage Type
New Conventional
Purchase Details
Closed on
May 24, 2007
Sold by
Schmidt Henry
Bought by
Rzonca Edward
Purchase Details
Closed on
Mar 7, 2001
Create a Home Valuation Report for This Property
The Home Valuation Report is an in-depth analysis detailing your home's value as well as a comparison with similar homes in the area
Home Values in the Area
Average Home Value in this Area
Purchase History
| Date | Buyer | Sale Price | Title Company |
|---|---|---|---|
| Abbey Maria | $485,000 | Chicago Title | |
| Almonacid Gisselle Fernanda | $250,000 | None Available | |
| Rzonca Edward | $380,000 | -- | |
| -- | $25,000 | -- |
Source: Public Records
Mortgage History
| Date | Status | Borrower | Loan Amount |
|---|---|---|---|
| Open | Abbey Maria | $456,000 | |
| Previous Owner | Almonacid Gisselle Fernanda | $237,500 |
Source: Public Records
Tax History
| Year | Tax Paid | Tax Assessment Tax Assessment Total Assessment is a certain percentage of the fair market value that is determined by local assessors to be the total taxable value of land and additions on the property. | Land | Improvement |
|---|---|---|---|---|
| 2025 | $11,392 | $349 | $211 | $138 |
| 2024 | $2,972 | $349 | $211 | $138 |
Source: Public Records
Map
Nearby Homes
Your Personal Tour Guide
Ask me questions while you tour the home.