359 Mansfield St Unit 1 Sharon, MA 02067
Highlights
- Golf Course Community
- Medical Services
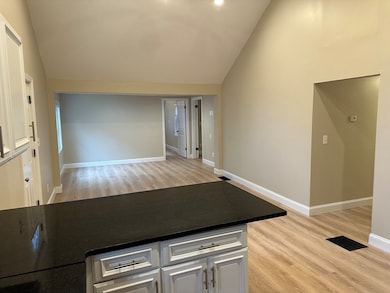
- Open Floorplan
- Heights Elementary School Rated A+
- 86,970 Sq Ft lot
- Deck
About This Home
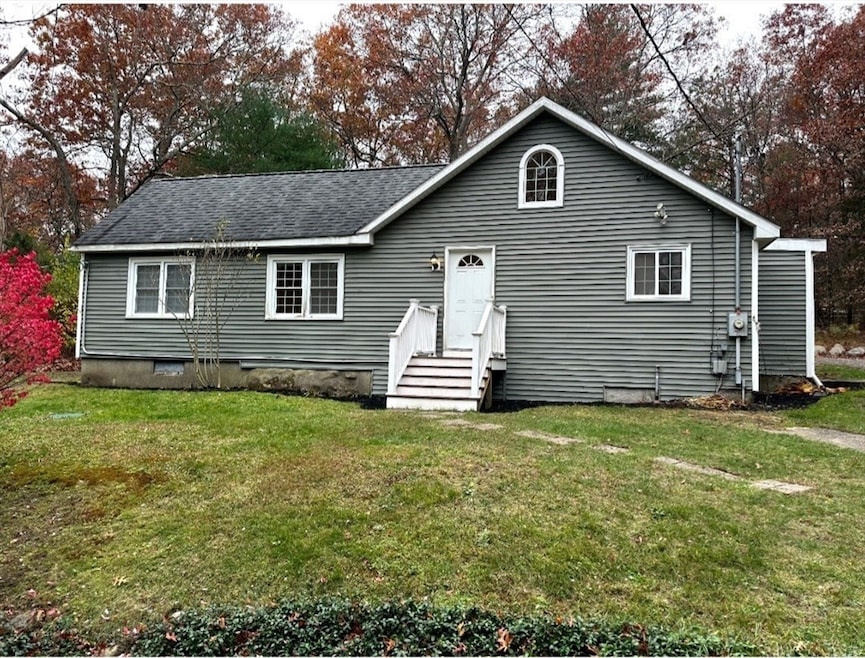
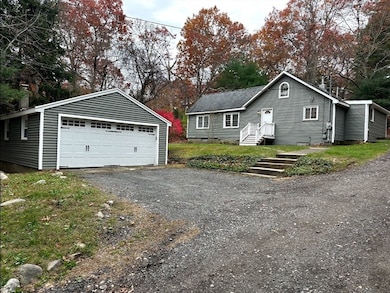
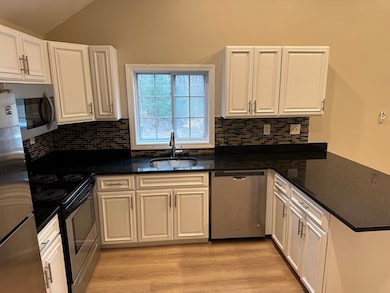
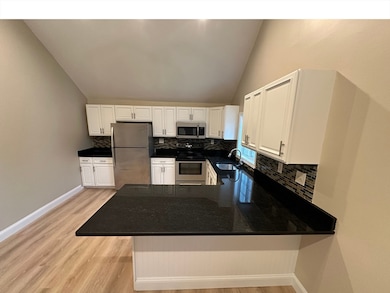
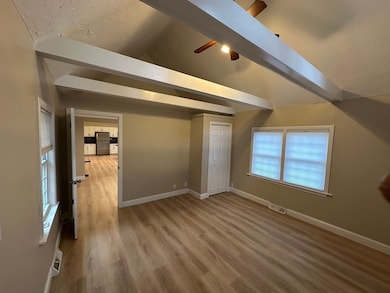
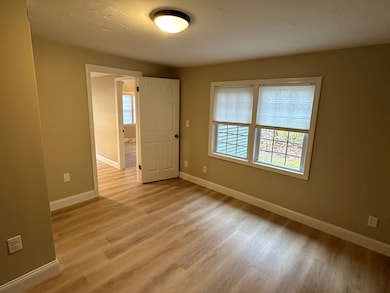
Looking for easy one-floor living on a quiet, winding country road? This beautifully renovated 3-bedroom 1.5-bath home offers modern comfort in a serene setting. Enjoy a spacious open-concept kitchen with granite countertops, stainless steel appliances & plenty of room for entertaining. The family room features cathedral ceilings, a ceiling fan & abundant natural light, perfect for relaxing or gathering with friends & family. The master bedroom includes a vaulted ceiling, ceiling fan and convenient loft storage. Two additional bedrooms offer generous space & versatility. Luxury vinyl plank flooring runs throughout for a clean, cohesive look. The partially finished basement adds 318 sq. ft. of flexible living space, ideal for a home office, playroom or media area. The entire interior has been freshly painted and move-in ready. Step outside to a sunny back deck with a grill, perfect for outdoor dining or enjoying peaceful views. A detached 2-car garage provides ample parking and storage.
Home Details
Home Type
- Single Family
Est. Annual Taxes
- $11,483
Year Built
- Built in 1930 | Remodeled
Parking
- 2 Car Garage
Home Design
- Entry on the 1st floor
Interior Spaces
- 1-Story Property
- Open Floorplan
- Cathedral Ceiling
- Ceiling Fan
- Recessed Lighting
- Light Fixtures
- Dining Area
- Basement
Kitchen
- Range
- Microwave
- Freezer
- Dishwasher
- Stainless Steel Appliances
- Kitchen Island
- Solid Surface Countertops
Flooring
- Ceramic Tile
- Vinyl
Bedrooms and Bathrooms
- 3 Bedrooms
- Double Vanity
- Bathtub with Shower
Laundry
- Laundry on main level
- Laundry in Bathroom
- Dryer
- Washer
Location
- Property is near public transit
- Property is near schools
Utilities
- No Cooling
- Heating System Uses Oil
Additional Features
- Deck
- 2 Acre Lot
Listing and Financial Details
- Security Deposit $1,000
- Rent includes water, sewer, trash collection, snow removal, gardener, parking
- Assessor Parcel Number M:001 B:002 L:000,219479
Community Details
Overview
- No Home Owners Association
- Near Conservation Area
Amenities
- Medical Services
- Shops
Recreation
- Golf Course Community
- Tennis Courts
- Park
- Jogging Path
- Bike Trail
Pet Policy
- Call for details about the types of pets allowed
Map
Source: MLS Property Information Network (MLS PIN)
MLS Number: 73452324
APN: SHAR-000001-000002
Disclaimer: Certain information contained herein is derived from information provided by parties other than Homes.com. All information provided is deemed reliable, but is not guaranteed to be accurate and should be independently verified.
![]() The property listing data and information, or the Images, set forth herein were provided to MLS Property Information Network, Inc. from third party sources, including sellers, lessors and public records, and were compiled by MLS Property Information Network, Inc. The property listing data and information, and the Images, are for the personal, non-commercial use of consumers having a good faith interest in purchasing or leasing listed properties of the type displayed to them and may not be used for any purpose other than to identify prospective properties which such consumers may have a good faith interest in purchasing or leasing. MLS Property Information Network, Inc. and its subscribers disclaim any and all representations and warranties as to the accuracy of the property listing data and information, or as to the accuracy of any of the Images, set forth herein.
The property listing data and information, or the Images, set forth herein were provided to MLS Property Information Network, Inc. from third party sources, including sellers, lessors and public records, and were compiled by MLS Property Information Network, Inc. The property listing data and information, and the Images, are for the personal, non-commercial use of consumers having a good faith interest in purchasing or leasing listed properties of the type displayed to them and may not be used for any purpose other than to identify prospective properties which such consumers may have a good faith interest in purchasing or leasing. MLS Property Information Network, Inc. and its subscribers disclaim any and all representations and warranties as to the accuracy of the property listing data and information, or as to the accuracy of any of the Images, set forth herein.
- 260 Massapoag Ave
- 218 Massapoag Ave
- 3 Nicole Rd
- 261 East St
- 1 Revere Dr
- 7 Revere Dr
- 98 Massapoag Ave
- 12 Community Way
- 3 Cushing Ln
- 29 Owl Ridge Rd
- 89 Massapoag Ave
- 151 Stearns Ave
- 35 Independence Dr Unit 35
- 9 Independence Dr Unit 9
- 67 Morse St
- 10 Erick Rd Unit 34
- 10 Erick Rd Unit 31
- 132 Cannon Forge Dr
- 5 Pineview Terrace
- 170 Cannon Forge Dr
- 474 Franklin St Unit 476
- 15 Boyden Dr
- 12 Bonney Ln
- 10 Conners Ave
- 9 Francis Ave
- 149 Oakland St
- 150 Oakland St
- 647 N Main St Unit 2 Upper
- 60 Robert Dr Unit FL1-ID5564A
- 60 Robert Dr Unit FL1-ID4528A
- 60 Robert Dr Unit FL1-ID5499A
- 60 Robert Dr Unit FL2-ID5494A
- 60 Robert Dr Unit FL2-ID5459A
- 60 Robert Dr Unit FL3-ID5444A
- 60 Robert Dr Unit FL2-ID5428A
- 60 Robert Dr Unit FL3-ID5404A
- 60 Robert Dr Unit FL2-ID5403A
- 60 Robert Dr Unit FL3-ID2479A
- 60 Robert Dr Unit FL3-ID4509A
- 60 Robert Dr Unit FL0-ID4093A
