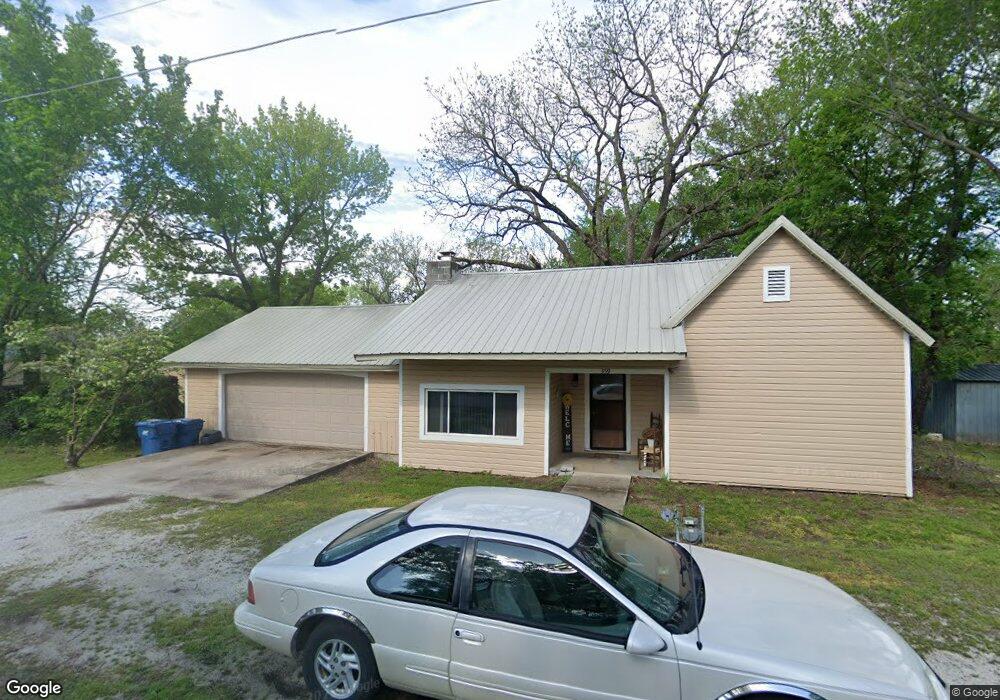
359 Munson St Oronogo, MO 64855
Estimated Value: $57,000 - $170,000
2
Beds
1
Bath
1,250
Sq Ft
$94/Sq Ft
Est. Value
About This Home
This home is located at 359 Munson St, Oronogo, MO 64855 and is currently estimated at $117,425, approximately $93 per square foot. 359 Munson St is a home located in Jasper County with nearby schools including Webb City High School.
Ownership History
Date
Name
Owned For
Owner Type
Purchase Details
Closed on
Mar 29, 2006
Sold by
Jackson Charles and Jackson Elsie
Bought by
Jackson Charles I and Jackson Marcella A
Current Estimated Value
Create a Home Valuation Report for This Property
The Home Valuation Report is an in-depth analysis detailing your home's value as well as a comparison with similar homes in the area
Home Values in the Area
Average Home Value in this Area
Purchase History
| Date | Buyer | Sale Price | Title Company |
|---|---|---|---|
| Jackson Charles I | -- | None Available |
Source: Public Records
Tax History Compared to Growth
Tax History
| Year | Tax Paid | Tax Assessment Tax Assessment Total Assessment is a certain percentage of the fair market value that is determined by local assessors to be the total taxable value of land and additions on the property. | Land | Improvement |
|---|---|---|---|---|
| 2025 | $564 | $12,240 | $1,500 | $10,740 |
| 2024 | $564 | $10,860 | $1,500 | $9,360 |
| 2023 | $564 | $10,860 | $1,500 | $9,360 |
| 2022 | $550 | $10,630 | $1,500 | $9,130 |
| 2021 | $547 | $10,630 | $1,500 | $9,130 |
| 2020 | $486 | $9,830 | $1,500 | $8,330 |
| 2019 | $487 | $9,830 | $1,500 | $8,330 |
| 2018 | $463 | $9,380 | $0 | $0 |
| 2017 | $465 | $9,380 | $0 | $0 |
| 2016 | $433 | $9,380 | $0 | $0 |
| 2015 | -- | $9,380 | $0 | $0 |
| 2014 | -- | $9,380 | $0 | $0 |
Source: Public Records
Map
Nearby Homes
- 272 Elk St
- 471 W Amber Dr
- 912 E Amber Dr
- Tbd E Central St
- 918 Caitlan Dr
- 190 Alvin Ct
- TBD S 4th St
- 1068 Alexsandra Cir
- 000 State Highway 96
- 350 Swaden Ln
- 628 Josh Ct
- 226 S Highway D
- 793 N State Hwy D
- 8991 County Road 220
- 1106 Pawpaw Place
- 9960 Cr 215
- 2237 N Greystone Square
- 8940 County Lane 214
- 355 Sadie Ln
- 322 Sidney Ln