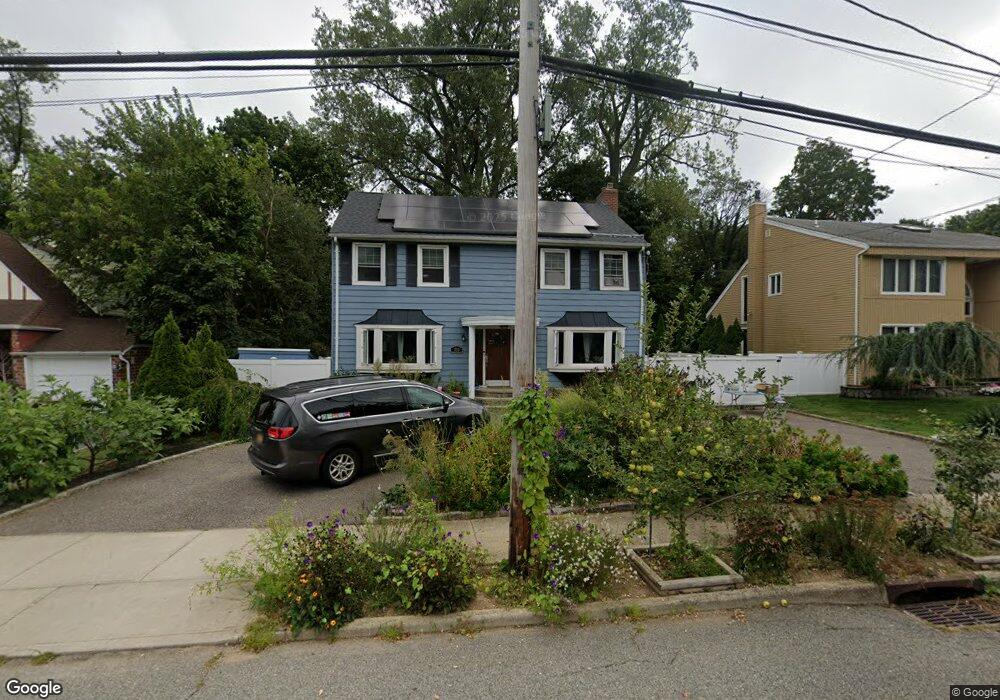
359 Ocean Ave Massapequa, NY 11758
Estimated Value: $944,954 - $968,000
3
Beds
3
Baths
2,816
Sq Ft
$340/Sq Ft
Est. Value
About This Home
This home is located at 359 Ocean Ave, Massapequa, NY 11758 and is currently estimated at $956,477, approximately $339 per square foot. 359 Ocean Ave is a home located in Nassau County with nearby schools including Massapequa High School - Ames Campus, Berner Middle School, and Massapequa High School.
Ownership History
Date
Name
Owned For
Owner Type
Purchase Details
Closed on
May 27, 2021
Sold by
Sayan Eugene and Sayan Fatma
Bought by
Boyle Kevin and Giliberti Andrea
Current Estimated Value
Home Financials for this Owner
Home Financials are based on the most recent Mortgage that was taken out on this home.
Original Mortgage
$548,000
Outstanding Balance
$496,146
Interest Rate
2.9%
Mortgage Type
New Conventional
Estimated Equity
$460,331
Purchase Details
Closed on
Mar 26, 2007
Sold by
Calvaruso Patricia
Bought by
Sayan Eugene
Create a Home Valuation Report for This Property
The Home Valuation Report is an in-depth analysis detailing your home's value as well as a comparison with similar homes in the area
Home Values in the Area
Average Home Value in this Area
Purchase History
| Date | Buyer | Sale Price | Title Company |
|---|---|---|---|
| Boyle Kevin | $735,000 | Chicago Title | |
| Sayan Eugene | $560,000 | -- |
Source: Public Records
Mortgage History
| Date | Status | Borrower | Loan Amount |
|---|---|---|---|
| Open | Boyle Kevin | $548,000 |
Source: Public Records
Tax History Compared to Growth
Tax History
| Year | Tax Paid | Tax Assessment Tax Assessment Total Assessment is a certain percentage of the fair market value that is determined by local assessors to be the total taxable value of land and additions on the property. | Land | Improvement |
|---|---|---|---|---|
| 2025 | $16,668 | $585 | $181 | $404 |
| 2024 | $5,008 | $559 | $173 | $386 |
| 2023 | $19,139 | $642 | $198 | $444 |
| 2022 | $19,139 | $676 | $209 | $467 |
| 2021 | $21,178 | $651 | $201 | $450 |
| 2020 | $23,467 | $1,325 | $743 | $582 |
| 2019 | $7,114 | $1,325 | $743 | $582 |
| 2018 | $14,698 | $1,325 | $0 | $0 |
| 2017 | $12,858 | $1,325 | $743 | $582 |
| 2016 | $19,303 | $1,325 | $743 | $582 |
| 2015 | $5,785 | $1,325 | $743 | $582 |
| 2014 | $5,785 | $1,325 | $743 | $582 |
| 2013 | $5,261 | $1,325 | $743 | $582 |
Source: Public Records
Map
Nearby Homes