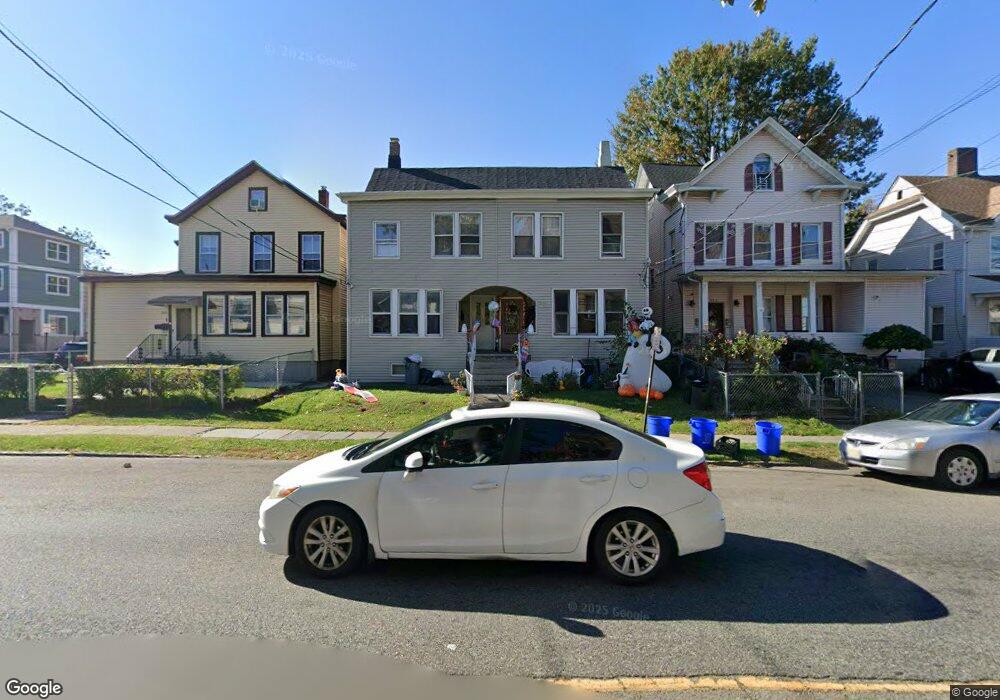
359 Paulison Ave Passaic, NJ 07055
Estimated Value: $428,000 - $533,000
4
Beds
2
Baths
2,048
Sq Ft
$243/Sq Ft
Est. Value
About This Home
This home is located at 359 Paulison Ave, Passaic, NJ 07055 and is currently estimated at $497,847, approximately $243 per square foot. 359 Paulison Ave is a home located in Passaic County with nearby schools including Passaic High School # 12 and Passaic Arts and Science Charter School.
Ownership History
Date
Name
Owned For
Owner Type
Purchase Details
Closed on
Jan 17, 2019
Sold by
U S Bank Na
Bought by
Pani Realty Llc
Current Estimated Value
Purchase Details
Closed on
Feb 20, 2018
Sold by
Juarez Mirna E and Juarez Manuel A
Bought by
U S Bank Na and Bank Of America Na
Purchase Details
Closed on
Jun 9, 2005
Sold by
Peralta Rafael
Bought by
Juarez Mirna E
Home Financials for this Owner
Home Financials are based on the most recent Mortgage that was taken out on this home.
Original Mortgage
$247,950
Interest Rate
5.81%
Purchase Details
Closed on
Nov 15, 2004
Sold by
Salerno Dominick
Bought by
Peralta Rafael
Home Financials for this Owner
Home Financials are based on the most recent Mortgage that was taken out on this home.
Original Mortgage
$132,000
Interest Rate
5.69%
Create a Home Valuation Report for This Property
The Home Valuation Report is an in-depth analysis detailing your home's value as well as a comparison with similar homes in the area
Home Values in the Area
Average Home Value in this Area
Purchase History
| Date | Buyer | Sale Price | Title Company |
|---|---|---|---|
| Pani Realty Llc | $167,000 | Vintage Title Services Llc | |
| U S Bank Na | -- | None Available | |
| Juarez Mirna E | $261,000 | -- | |
| Peralta Rafael | $165,000 | -- |
Source: Public Records
Mortgage History
| Date | Status | Borrower | Loan Amount |
|---|---|---|---|
| Previous Owner | Juarez Mirna E | $247,950 | |
| Previous Owner | Peralta Rafael | $132,000 |
Source: Public Records
Tax History Compared to Growth
Tax History
| Year | Tax Paid | Tax Assessment Tax Assessment Total Assessment is a certain percentage of the fair market value that is determined by local assessors to be the total taxable value of land and additions on the property. | Land | Improvement |
|---|---|---|---|---|
| 2025 | $9,363 | $227,100 | $55,400 | $171,700 |
| 2024 | $9,093 | $227,100 | $55,400 | $171,700 |
| 2022 | $8,821 | $227,100 | $55,400 | $171,700 |
| 2021 | $8,539 | $227,100 | $55,400 | $171,700 |
| 2020 | $8,473 | $227,100 | $55,400 | $171,700 |
| 2019 | $8,350 | $227,100 | $55,400 | $171,700 |
| 2018 | $8,171 | $227,100 | $55,400 | $171,700 |
| 2017 | $7,919 | $227,100 | $55,400 | $171,700 |
| 2016 | $7,649 | $227,100 | $55,400 | $171,700 |
| 2015 | $6,695 | $88,400 | $49,000 | $39,400 |
| 2014 | $6,572 | $88,400 | $49,000 | $39,400 |
Source: Public Records
Map
Nearby Homes
- 233 Howe Ave
- 355 Madison St
- 20 Wickham St
- 15 Albion St
- 48 8th Ave
- 514 Lafayette Ave Unit 518
- 514-518 Lafayette Ave
- 339 Broadway
- 74-78 Hammond Ave
- 35 7th Ave
- 260 Madison St
- 285 Aycrigg Ave Unit 22D
- 285 Aycrigg Ave Unit 20C
- 285 Aycrigg Ave Unit 19G
- 285 Aycrigg Ave Unit 22
- 285 Aycrigg Ave Unit 19H
- 101 Prospect St
- 385 Broadway
- 357 Paulison Ave
- 361 Paulison Ave
- 367 Paulison Ave
- 353 Paulison Ave
- 369 Paulison Ave
- 200 Howe Ave
- 345 Paulison Ave
- 183 Howe Ave
- 185 Howe Ave
- 187 Howe Ave
- 189 Howe Ave
- 177 Howe Ave
- 371 Paulison Ave
- 186 Howe Ave
- 370 Paulison Ave
- 208 Howe Ave
- 208 Howe Ave Unit 2F
- 368 Paulison Ave
- 187 1/2 Howe Ave
- 187-1/2 Howe Ave