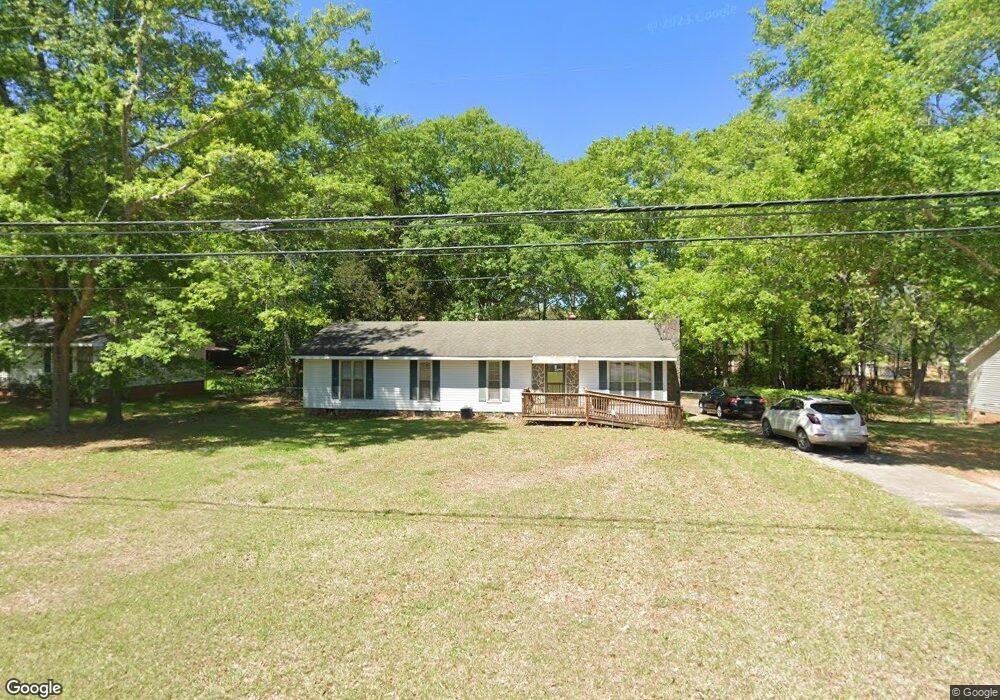
359 Redbud Dr Barnesville, GA 30204
Estimated Value: $211,395 - $279,000
2
Beds
2
Baths
1,425
Sq Ft
$169/Sq Ft
Est. Value
About This Home
This home is located at 359 Redbud Dr, Barnesville, GA 30204 and is currently estimated at $240,349, approximately $168 per square foot. 359 Redbud Dr is a home located in Lamar County with nearby schools including Lamar County Primary School, Lamar County Elementary School, and Lamar County Middle School.
Ownership History
Date
Name
Owned For
Owner Type
Purchase Details
Closed on
May 31, 2019
Sold by
Kingsley Kent E
Bought by
Greene Lawrence W and Greene Harriette A
Current Estimated Value
Home Financials for this Owner
Home Financials are based on the most recent Mortgage that was taken out on this home.
Original Mortgage
$88,500
Outstanding Balance
$77,185
Interest Rate
6.87%
Mortgage Type
New Conventional
Estimated Equity
$163,164
Purchase Details
Closed on
Sep 26, 2011
Sold by
Kingsley Kent E
Bought by
Kingsley Kent E
Purchase Details
Closed on
May 14, 2008
Sold by
Sec Of Housing & U
Bought by
Hatten Mark
Purchase Details
Closed on
Apr 13, 2007
Sold by
Not Provided
Bought by
Kingsley Kent E
Home Financials for this Owner
Home Financials are based on the most recent Mortgage that was taken out on this home.
Original Mortgage
$84,000
Interest Rate
6.1%
Mortgage Type
New Conventional
Purchase Details
Closed on
Dec 17, 1999
Sold by
Smith Jim Franklin
Bought by
Smith Joy Priscilla
Create a Home Valuation Report for This Property
The Home Valuation Report is an in-depth analysis detailing your home's value as well as a comparison with similar homes in the area
Home Values in the Area
Average Home Value in this Area
Purchase History
| Date | Buyer | Sale Price | Title Company |
|---|---|---|---|
| Greene Lawrence W | $110,000 | -- | |
| Kingsley Kent E | -- | -- | |
| Hatten Mark | $38,300 | -- | |
| Kingsley Kent E | $105,000 | -- | |
| Smith Joy Priscilla | -- | -- |
Source: Public Records
Mortgage History
| Date | Status | Borrower | Loan Amount |
|---|---|---|---|
| Open | Greene Lawrence W | $88,500 | |
| Previous Owner | Kingsley Kent E | $84,000 |
Source: Public Records
Tax History
| Year | Tax Paid | Tax Assessment Tax Assessment Total Assessment is a certain percentage of the fair market value that is determined by local assessors to be the total taxable value of land and additions on the property. | Land | Improvement |
|---|---|---|---|---|
| 2025 | $1,958 | $73,064 | $6,800 | $66,264 |
| 2024 | $1,739 | $60,672 | $6,800 | $53,872 |
| 2023 | $1,739 | $56,335 | $6,800 | $49,535 |
| 2022 | $1,415 | $51,244 | $6,800 | $44,444 |
| 2021 | $1,271 | $42,273 | $6,800 | $35,473 |
| 2020 | $1,206 | $38,090 | $6,800 | $31,290 |
| 2019 | $1,209 | $38,090 | $6,800 | $31,290 |
| 2018 | $1,141 | $37,439 | $6,800 | $30,639 |
| 2017 | $1,135 | $37,439 | $6,800 | $30,639 |
| 2016 | $1,135 | $37,439 | $6,800 | $30,639 |
| 2015 | $1,134 | $37,439 | $6,800 | $30,639 |
| 2014 | $1,099 | $37,439 | $6,800 | $30,639 |
| 2013 | -- | $37,439 | $6,800 | $30,639 |
Source: Public Records
Map
Nearby Homes
- 329 Pine St
- 205 Pine St
- 1013 Veterans Pkwy
- 0 College Dr Unit 10632977
- 0 Yatesville Rd Unit 10650403
- 0 Us Highway 41
- 0 Highway 341 S Unit 181569
- 0 Highway 341 S Unit 10610486
- 108 Bradley Cir
- 0 Veterns Pkwy Unit 10515268
- 187 Coffey Rd
- 147 Stafford Ave
- 114 Stafford Ave
- 149 Holmes St
- 642 Greenwood St
- 531 Thomaston St
- 275 Rose Ave
- 0 Martin Luther King Junior Pkwy
- 24 Sims St
- 0 Hannah Ct Unit LOT 13 10587187
Your Personal Tour Guide
Ask me questions while you tour the home.