Estimated Value: $401,000 - $553,000
6
Beds
3
Baths
3,422
Sq Ft
$144/Sq Ft
Est. Value
About This Home
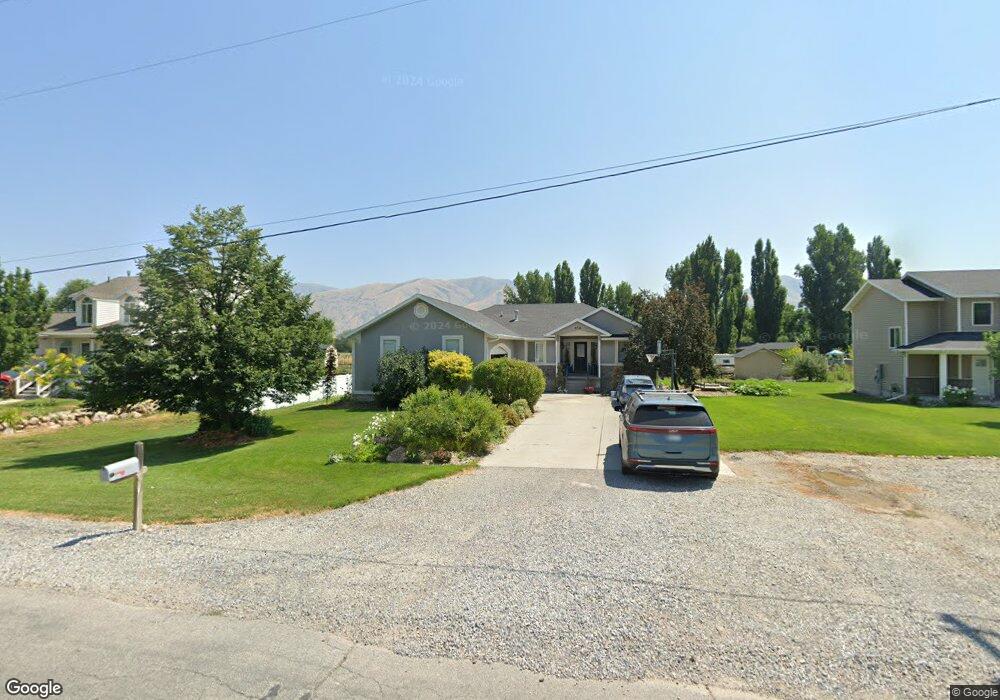
This home is located at 359 S 100 E, Hyrum, UT 84319 and is currently estimated at $493,839, approximately $144 per square foot. 359 S 100 E is a home located in Cache County with nearby schools including Lincoln School, South Cache Middle School, and Mountain Crest High School.
Ownership History
Date
Name
Owned For
Owner Type
Purchase Details
Closed on
Apr 6, 2009
Sold by
Pruden David Clarke
Bought by
Pruden David Clarke and Pruden Denae
Current Estimated Value
Home Financials for this Owner
Home Financials are based on the most recent Mortgage that was taken out on this home.
Original Mortgage
$193,000
Outstanding Balance
$48,106
Interest Rate
5.06%
Mortgage Type
New Conventional
Estimated Equity
$445,733
Purchase Details
Closed on
Jan 8, 2007
Sold by
Pruden David C
Bought by
Pruden David C and Pruden Denae
Home Financials for this Owner
Home Financials are based on the most recent Mortgage that was taken out on this home.
Original Mortgage
$160,000
Interest Rate
6.16%
Mortgage Type
New Conventional
Purchase Details
Closed on
Aug 18, 2005
Sold by
Munson Ronald K
Bought by
Munson Tracy H
Create a Home Valuation Report for This Property
The Home Valuation Report is an in-depth analysis detailing your home's value as well as a comparison with similar homes in the area
Home Values in the Area
Average Home Value in this Area
Purchase History
| Date | Buyer | Sale Price | Title Company |
|---|---|---|---|
| Pruden David Clarke | -- | Cache Title Company | |
| Pruden David Clarke | -- | Cache Title Company | |
| Pruden David C | -- | Cache Title Company | |
| Pruden David C | -- | Cache Title Company | |
| Munson Tracy H | -- | None Available |
Source: Public Records
Mortgage History
| Date | Status | Borrower | Loan Amount |
|---|---|---|---|
| Open | Pruden David Clarke | $193,000 | |
| Closed | Pruden David C | $160,000 | |
| Closed | Pruden David C | $30,000 |
Source: Public Records
Tax History
| Year | Tax Paid | Tax Assessment Tax Assessment Total Assessment is a certain percentage of the fair market value that is determined by local assessors to be the total taxable value of land and additions on the property. | Land | Improvement |
|---|---|---|---|---|
| 2025 | $1,870 | $268,550 | $0 | $0 |
| 2024 | $1,991 | $267,000 | $0 | $0 |
| 2023 | $1,867 | $239,310 | $0 | $0 |
| 2022 | $1,948 | $239,310 | $0 | $0 |
| 2021 | $1,909 | $361,375 | $66,430 | $294,945 |
| 2020 | $1,592 | $282,745 | $66,430 | $216,315 |
| 2019 | $1,551 | $259,115 | $42,800 | $216,315 |
| 2018 | $1,430 | $230,900 | $42,800 | $188,100 |
| 2017 | $1,403 | $117,590 | $0 | $0 |
| 2016 | $1,435 | $117,590 | $0 | $0 |
| 2015 | $1,289 | $105,415 | $0 | $0 |
| 2014 | $1,260 | $105,305 | $0 | $0 |
| 2013 | -- | $105,305 | $0 | $0 |
Source: Public Records
Map
Nearby Homes
Your Personal Tour Guide
Ask me questions while you tour the home.