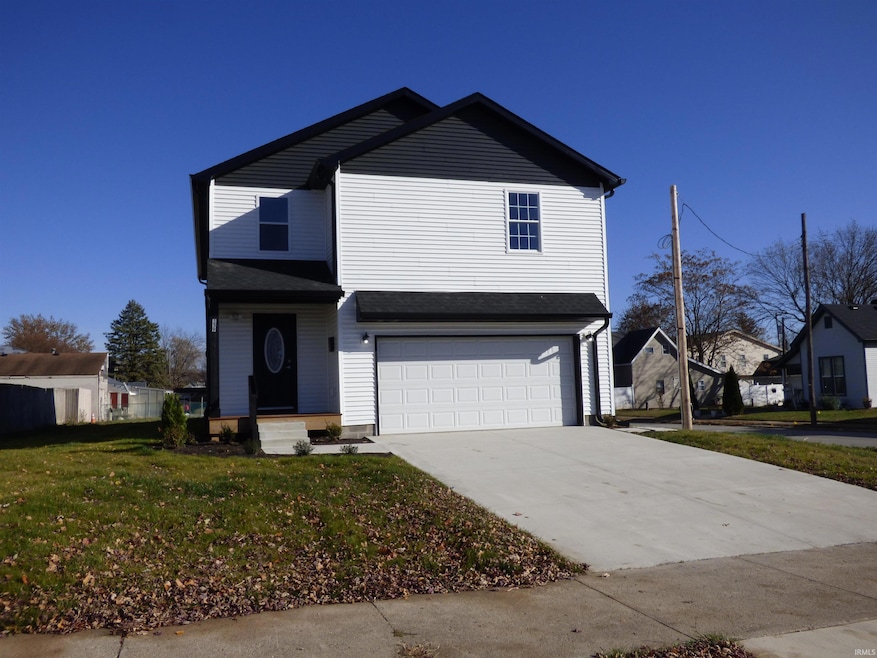

359 S 2nd St Frankfort, IN 46041
Estimated payment $1,797/month
Highlights
- Popular Property
- Traditional Architecture
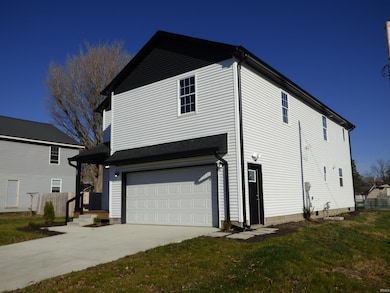
- Corner Lot
- Open Floorplan
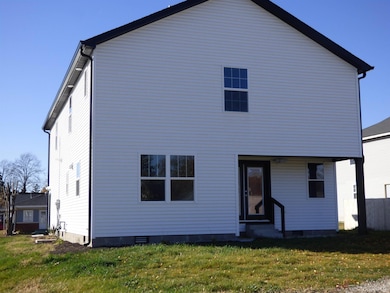
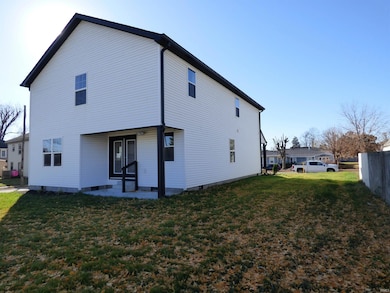
- Backs to Open Ground
- Solid Surface Countertops
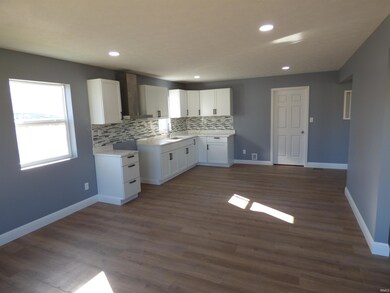
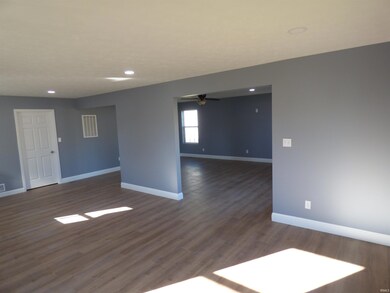
About This Home
Brand new build not far from downtown Frankfort! You will love this layout on this large four bedroom home that has two full baths upstairs and another half bath on the main floor. There is plenty of closet space just about everywhere you look, so your growing family has room to store all those Christmas presents, so if you hurry, you could be in this modern open concept home for the Holidays! This property also has a nice attached two car garage as well as extra off street parking in the back, so you will not have to worry about your cars being on the road. Do yourself a favor and check this one out right away.
Home Details
Home Type
- Single Family
Est. Annual Taxes
- $2,603
Year Built
- Built in 2025
Lot Details
- 8,712 Sq Ft Lot
- Lot Dimensions are 6 6x 132
- Backs to Open Ground
- Corner Lot
- Level Lot
Parking
- 2 Car Attached Garage
- Garage Door Opener
- Driveway
Home Design
- Traditional Architecture
- Shingle Roof
- Vinyl Construction Material
Interior Spaces
- 2,124 Sq Ft Home
- 2-Story Property
- Open Floorplan
- Vinyl Flooring
- Washer and Electric Dryer Hookup
Kitchen
- Walk-In Pantry
- Gas Oven or Range
- Solid Surface Countertops
Bedrooms and Bathrooms
- 4 Bedrooms
- En-Suite Primary Bedroom
- Walk-In Closet
- Double Vanity
- Bathtub with Shower
Basement
- Block Basement Construction
- Crawl Space
Schools
- Blue Ridge / Green Meadows Elementary School
- Frankfort Middle School
- Frankfort High School
Utilities
- Forced Air Heating and Cooling System
- Heating System Uses Gas
Additional Features
- Covered Patio or Porch
- Suburban Location
Listing and Financial Details
- Assessor Parcel Number 12-10-10-401-006.000-021
Map
Home Values in the Area
Average Home Value in this Area
Tax History
| Year | Tax Paid | Tax Assessment Tax Assessment Total Assessment is a certain percentage of the fair market value that is determined by local assessors to be the total taxable value of land and additions on the property. | Land | Improvement |
|---|---|---|---|---|
| 2024 | $1,676 | $73,900 | $8,900 | $65,000 |
| 2023 | $1,701 | $73,900 | $8,900 | $65,000 |
| 2022 | $1,690 | $73,900 | $8,900 | $65,000 |
| 2021 | $729 | $31,600 | $8,900 | $22,700 |
| 2020 | $753 | $31,600 | $8,900 | $22,700 |
| 2019 | $808 | $33,900 | $8,900 | $25,000 |
| 2018 | $799 | $33,900 | $8,900 | $25,000 |
| 2017 | $836 | $35,100 | $10,600 | $24,500 |
| 2016 | $832 | $34,500 | $10,600 | $23,900 |
| 2014 | $718 | $35,900 | $10,600 | $25,300 |
Property History
| Date | Event | Price | List to Sale | Price per Sq Ft |
|---|---|---|---|---|
| 11/21/2025 11/21/25 | Price Changed | $299,999 | -6.3% | $141 / Sq Ft |
| 11/14/2025 11/14/25 | For Sale | $320,000 | -- | $151 / Sq Ft |
Purchase History
| Date | Type | Sale Price | Title Company |
|---|---|---|---|
| Warranty Deed | -- | None Listed On Document | |
| Quit Claim Deed | -- | None Listed On Document | |
| Contract Of Sale | $75,000 | -- | |
| Warranty Deed | $12,000 | Landamerica Lawyers Title | |
| Special Warranty Deed | -- | None Available | |
| Sheriffs Deed | $23,365 | None Available |
Mortgage History
| Date | Status | Loan Amount | Loan Type |
|---|---|---|---|
| Previous Owner | $47,000 | Future Advance Clause Open End Mortgage |
Source: Indiana Regional MLS
MLS Number: 202546066
APN: 12-10-10-401-006.000-021
Disclaimer: Certain information contained herein is derived from information provided by parties other than Homes.com. All information provided is deemed reliable, but is not guaranteed to be accurate and should be independently verified.
![]() IDX information is provided exclusively for personal, non-commercial use, and may not be used for any purpose other than to identify prospective properties consumers may be interested in purchasing. Information is deemed reliable but not guaranteed.
IDX information is provided exclusively for personal, non-commercial use, and may not be used for any purpose other than to identify prospective properties consumers may be interested in purchasing. Information is deemed reliable but not guaranteed.
- 358 S Columbia St
- 556 W Boone St
- 506 W Walnut St
- 458 S Jackson St
- 250 252 W Washington St
- 250 , 252 W Washington St
- 652 S Jackson St
- 820 Hackberry Ct
- 258 Main Ave Unit 1-8
- 356 S 7th St
- 1209 E Wabash St
- 862 S Jackson St
- 353 Harvard Terrace
- 457 N Main St
- 557 E Boone St
- 508 Glendale Dr
- 353 Brightwood Dr
- 708 Glendale Dr
- 255 N East St
- 401 Knox St
- 55 N Jackson
- 951 E Wabash St
- 700 Saint Marys Ave
- 112 Autumn Ct
- 495 Hot Dog St
- 7520 W Manson Colfax Rd
- 6200 N State Road 39
- 1502 W 525 N
- 2640 Stonebridge Dr
- 2009 W 250 N
- 910 Red Hills Ct
- 830 Mcarthur Dr
- 2375 Shaker Ln
- 2000 Austin Dr
- 125 Clover Ct
- 1935 Lafayette Ave
- 1711 Lafayette Ave Unit 9
- 1310 Millerwood Ct Unit 1
- 1325 Millerwood Ct
- 829 Claiborne Ln
