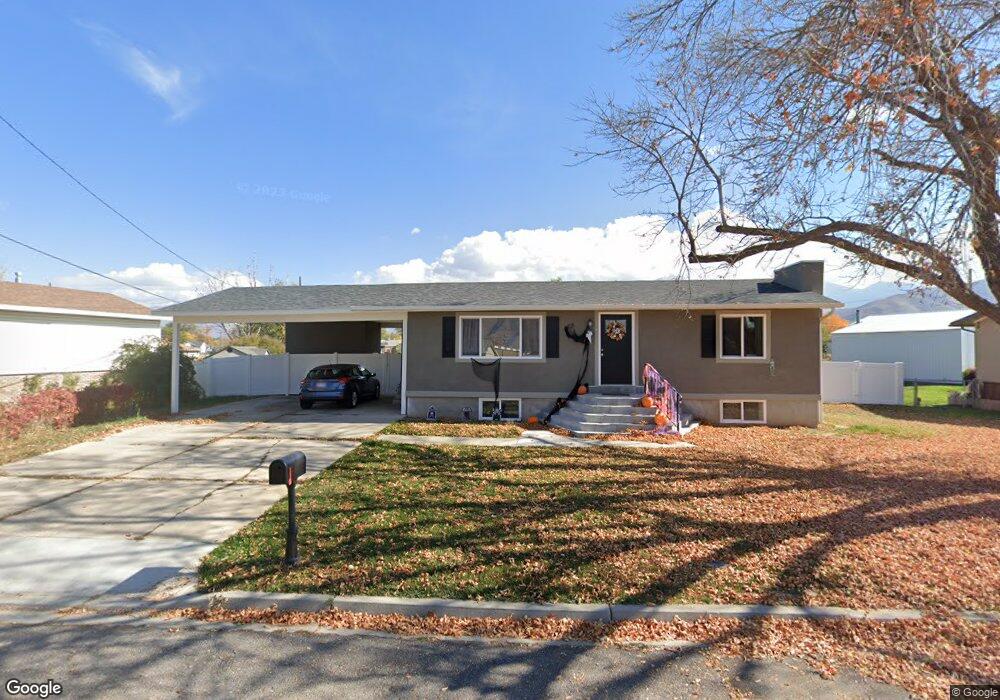
359 S 900 W Payson, UT 84651
Estimated Value: $559,000
5
Beds
3
Baths
2,474
Sq Ft
$226/Sq Ft
Est. Value
About This Home
This home is located at 359 S 900 W, Payson, UT 84651 and is currently priced at $559,000, approximately $225 per square foot. 359 S 900 W is a home located in Utah County with nearby schools including Wilson Elementary School, Mt. Nebo Junior High School, and Mt. Nebo Middle.
Ownership History
Date
Name
Owned For
Owner Type
Purchase Details
Closed on
Mar 30, 2023
Sold by
Topline Investment Group Llc
Bought by
Payne Diana and Payne Gary B
Current Estimated Value
Home Financials for this Owner
Home Financials are based on the most recent Mortgage that was taken out on this home.
Original Mortgage
$399,999
Outstanding Balance
$388,300
Interest Rate
6.32%
Mortgage Type
New Conventional
Purchase Details
Closed on
May 13, 2022
Sold by
Short Darren V
Bought by
Topline Investment Group Llc
Purchase Details
Closed on
Feb 15, 2000
Sold by
Midwest First Financial Ltd Prtnrshp Iii
Bought by
Short Darren and Short Lizette
Home Financials for this Owner
Home Financials are based on the most recent Mortgage that was taken out on this home.
Original Mortgage
$120,585
Interest Rate
8.14%
Purchase Details
Closed on
Jul 1, 1999
Sold by
Kleinsmith Philip M
Bought by
Midwest First Financial Ltd Prtnrshp Iii
Create a Home Valuation Report for This Property
The Home Valuation Report is an in-depth analysis detailing your home's value as well as a comparison with similar homes in the area
Home Values in the Area
Average Home Value in this Area
Purchase History
| Date | Buyer | Sale Price | Title Company |
|---|---|---|---|
| Payne Diana | -- | Real Advantage Title | |
| Topline Investment Group Llc | -- | Gt Title Services | |
| Short Darren | -- | Sundance Title Insurance | |
| Midwest First Financial Ltd Prtnrshp Iii | $115,000 | -- |
Source: Public Records
Mortgage History
| Date | Status | Borrower | Loan Amount |
|---|---|---|---|
| Open | Payne Diana | $399,999 | |
| Previous Owner | Short Darren | $120,585 |
Source: Public Records
Tax History Compared to Growth
Tax History
| Year | Tax Paid | Tax Assessment Tax Assessment Total Assessment is a certain percentage of the fair market value that is determined by local assessors to be the total taxable value of land and additions on the property. | Land | Improvement |
|---|---|---|---|---|
| 2022 | $2,255 | $226,325 | $0 | $0 |
| 2021 | $1,921 | $309,300 | $102,300 | $207,000 |
| 2020 | $1,821 | $286,800 | $93,000 | $193,800 |
| 2019 | $1,707 | $275,700 | $83,300 | $192,400 |
| 2018 | $1,553 | $241,700 | $74,400 | $167,300 |
| 2017 | $1,426 | $119,350 | $0 | $0 |
| 2016 | $1,312 | $109,065 | $0 | $0 |
| 2015 | $1,168 | $96,470 | $0 | $0 |
| 2014 | $1,149 | $95,590 | $0 | $0 |
Source: Public Records
Map
Nearby Homes