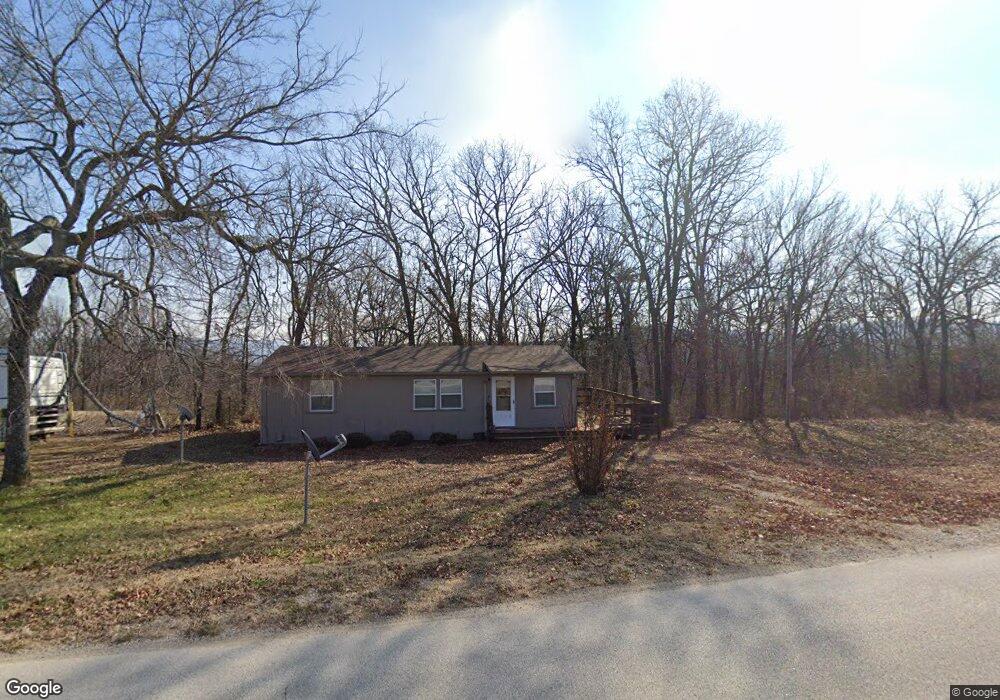
359 Sulphur City Rd Fayetteville, AR 72701
Estimated Value: $184,000 - $248,000
2
Beds
1
Bath
960
Sq Ft
$222/Sq Ft
Est. Value
About This Home
This home is located at 359 Sulphur City Rd, Fayetteville, AR 72701 and is currently estimated at $213,561, approximately $222 per square foot. 359 Sulphur City Rd is a home located in Washington County with nearby schools including Elkins Elementary Primary School, Elkins Elementary School, and Elkins Middle School.
Ownership History
Date
Name
Owned For
Owner Type
Purchase Details
Closed on
Jul 31, 2015
Bought by
Baker Sam
Current Estimated Value
Purchase Details
Closed on
Jul 26, 2007
Sold by
Gabbard Mike C and Gabbard Georgia F
Bought by
Wanslow Eleanor
Home Financials for this Owner
Home Financials are based on the most recent Mortgage that was taken out on this home.
Original Mortgage
$79,481
Interest Rate
6.69%
Mortgage Type
Purchase Money Mortgage
Purchase Details
Closed on
Dec 23, 1986
Bought by
Gabbard Mike C and Gabbard Georgia F
Purchase Details
Closed on
Oct 6, 1986
Bought by
Williford Ray Dean and Williford Doskie
Purchase Details
Closed on
Jul 24, 1984
Bought by
Warford Billy W
Purchase Details
Closed on
Jan 1, 1984
Bought by
Warford Clyde
Create a Home Valuation Report for This Property
The Home Valuation Report is an in-depth analysis detailing your home's value as well as a comparison with similar homes in the area
Home Values in the Area
Average Home Value in this Area
Purchase History
| Date | Buyer | Sale Price | Title Company |
|---|---|---|---|
| Baker Sam | $76,500 | -- | |
| Wanslow Eleanor | $79,000 | Cleartitle | |
| Gabbard Mike C | $6,000 | -- | |
| Williford Ray Dean | $2,000 | -- | |
| Warford Billy W | -- | -- | |
| Warford Clyde | -- | -- |
Source: Public Records
Mortgage History
| Date | Status | Borrower | Loan Amount |
|---|---|---|---|
| Previous Owner | Wanslow Eleanor | $79,481 |
Source: Public Records
Tax History Compared to Growth
Tax History
| Year | Tax Paid | Tax Assessment Tax Assessment Total Assessment is a certain percentage of the fair market value that is determined by local assessors to be the total taxable value of land and additions on the property. | Land | Improvement |
|---|---|---|---|---|
| 2025 | $1,020 | $26,430 | $9,000 | $17,430 |
| 2024 | $942 | $26,430 | $9,000 | $17,430 |
| 2023 | $884 | $26,430 | $9,000 | $17,430 |
| 2022 | $804 | $15,920 | $4,600 | $11,320 |
| 2021 | $773 | $15,920 | $4,600 | $11,320 |
| 2020 | $709 | $15,920 | $4,600 | $11,320 |
| 2019 | $272 | $12,760 | $3,500 | $9,260 |
| 2018 | $297 | $12,760 | $3,500 | $9,260 |
| 2017 | $291 | $12,760 | $3,500 | $9,260 |
| 2016 | $291 | $12,760 | $3,500 | $9,260 |
| 2015 | $641 | $12,760 | $3,500 | $9,260 |
| 2014 | $616 | $12,280 | $3,000 | $9,280 |
Source: Public Records
Map
Nearby Homes
- Tract 3a Downing Rd
- Tract 1a Downing Rd
- Tract 2b Downing Rd
- Tract 2a Downing Rd
- Tract 1b Downing Rd
- 567 Jason St
- 136 Downing (Wc) Rd
- 1036 Adysen Ln
- 461 Saydi St
- 430 Saydi St
- 445 Saydi St
- 429 Saydi St
- RC Carnegie II Plan at Stokenbury
- RC Keswick Plan at Stokenbury
- RC Foster II Plan at Stokenbury
- RC Franklin Plan at Stokenbury
- RC Glenwood Plan at Stokenbury
- RC Raleigh Plan at Stokenbury
- RC Kinsley II Plan at Stokenbury
- RC Ross Plan at Stokenbury
- 359 Sulphur City Rd
- 325 Sulphur City Rd
- 399 Sulphur City Rd
- 377 Sulphur City Rd
- 0 Sulphur City Rd
- 285 Sulphur City Rd
- 288 Sulphur City Rd
- 288 Sulphur City Rd
- 419 Sulphur City Rd
- 319 Oneal Ln
- 390 Oneal Ln
- 426 Sulphur City Rd
- 279 Oneal Ln
- 279 Oneal Ln
- 630 Hattabaugh Dr
- 227 Sulphur City Rd
- 219 Sulphur City Rd
- 620 Hattabaugh Dr
- Tract C Oneal Ln
- Tract B Oneal Ln