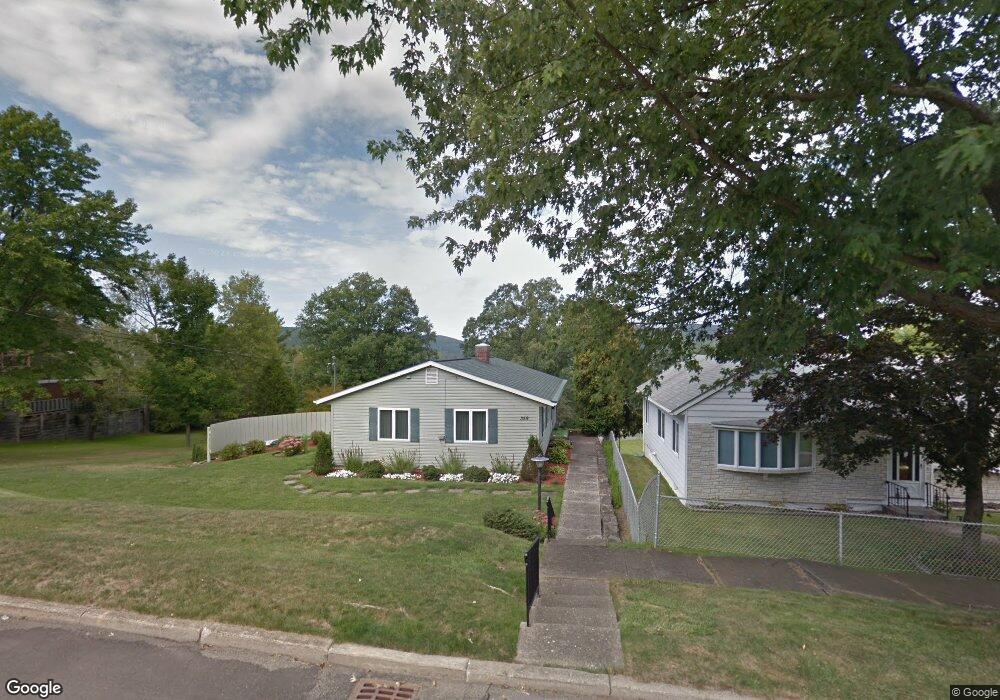
359 W 2nd St Corning, NY 14830
Estimated Value: $165,000 - $205,000
3
Beds
1
Bath
1,396
Sq Ft
$139/Sq Ft
Est. Value
About This Home
This home is located at 359 W 2nd St, Corning, NY 14830 and is currently estimated at $194,015, approximately $138 per square foot. 359 W 2nd St is a home located in Steuben County with nearby schools including Frederick Carder Elementary School, Corning-Painted Post Middle School, and Corning-Painted Post High School.
Ownership History
Date
Name
Owned For
Owner Type
Purchase Details
Closed on
Nov 12, 2024
Sold by
Browning Ft and Browning
Bought by
Woodcock Matthew D
Current Estimated Value
Home Financials for this Owner
Home Financials are based on the most recent Mortgage that was taken out on this home.
Original Mortgage
$159,200
Outstanding Balance
$157,615
Interest Rate
6.12%
Mortgage Type
Purchase Money Mortgage
Estimated Equity
$36,400
Purchase Details
Closed on
Jul 22, 2011
Sold by
Browning John
Bought by
Browning Family Revoc Trust
Purchase Details
Closed on
Jul 9, 2001
Sold by
Thomson Marion G
Bought by
Browning John W
Create a Home Valuation Report for This Property
The Home Valuation Report is an in-depth analysis detailing your home's value as well as a comparison with similar homes in the area
Home Values in the Area
Average Home Value in this Area
Purchase History
| Date | Buyer | Sale Price | Title Company |
|---|---|---|---|
| Woodcock Matthew D | $199,000 | None Available | |
| Woodcock Matthew D | $199,000 | None Available | |
| Browning Family Revoc Trust | -- | -- | |
| Browning Family Revoc Trust | -- | -- | |
| Browning John W | -- | -- | |
| Browning John W | -- | -- |
Source: Public Records
Mortgage History
| Date | Status | Borrower | Loan Amount |
|---|---|---|---|
| Open | Woodcock Matthew D | $159,200 | |
| Closed | Woodcock Matthew D | $159,200 |
Source: Public Records
Tax History
| Year | Tax Paid | Tax Assessment Tax Assessment Total Assessment is a certain percentage of the fair market value that is determined by local assessors to be the total taxable value of land and additions on the property. | Land | Improvement |
|---|---|---|---|---|
| 2024 | $4,778 | $174,000 | $25,300 | $148,700 |
| 2023 | $4,831 | $174,000 | $25,300 | $148,700 |
| 2022 | $6,114 | $130,000 | $25,300 | $104,700 |
| 2021 | $4,497 | $130,000 | $25,300 | $104,700 |
| 2020 | $2,816 | $130,000 | $25,300 | $104,700 |
| 2019 | $5,798 | $130,000 | $25,300 | $104,700 |
| 2018 | $5,798 | $130,000 | $25,300 | $104,700 |
| 2017 | $4,293 | $130,000 | $25,300 | $104,700 |
| 2016 | $4,245 | $130,000 | $25,300 | $104,700 |
| 2015 | -- | $130,000 | $25,300 | $104,700 |
| 2014 | -- | $130,000 | $25,300 | $104,700 |
Source: Public Records
Map
Nearby Homes
Your Personal Tour Guide
Ask me questions while you tour the home.