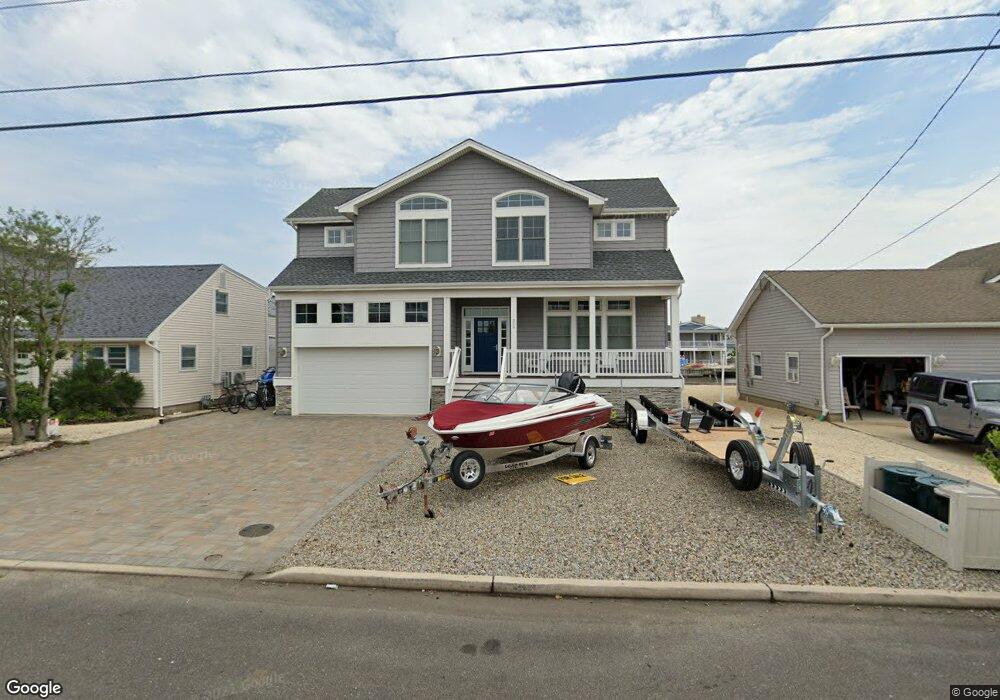
359 W 5th St Ship Bottom, NJ 08008
Long Beach Island NeighborhoodEstimated Value: $1,622,000 - $2,307,000
4
Beds
4
Baths
2,580
Sq Ft
$794/Sq Ft
Est. Value
About This Home
This home is located at 359 W 5th St, Ship Bottom, NJ 08008 and is currently estimated at $2,048,032, approximately $793 per square foot. 359 W 5th St is a home located in Ocean County with nearby schools including Ethel A. Jacobsen Elementary School, Long Beach Island Grade School, and Southern Regional Middle School.
Ownership History
Date
Name
Owned For
Owner Type
Purchase Details
Closed on
Aug 12, 2003
Sold by
Fegelein John
Bought by
Gusciora Robert and Johnson Cheryl
Current Estimated Value
Home Financials for this Owner
Home Financials are based on the most recent Mortgage that was taken out on this home.
Original Mortgage
$500,000
Outstanding Balance
$218,576
Interest Rate
5.52%
Estimated Equity
$1,829,456
Purchase Details
Closed on
Sep 9, 1994
Sold by
Camisa Robert
Bought by
Tegelein John and Tegelein Brenda
Home Financials for this Owner
Home Financials are based on the most recent Mortgage that was taken out on this home.
Original Mortgage
$200,000
Interest Rate
8.38%
Purchase Details
Closed on
May 19, 1994
Sold by
Armstrong John
Bought by
Camisa Robert and Camisa Hildegard
Create a Home Valuation Report for This Property
The Home Valuation Report is an in-depth analysis detailing your home's value as well as a comparison with similar homes in the area
Home Values in the Area
Average Home Value in this Area
Purchase History
| Date | Buyer | Sale Price | Title Company |
|---|---|---|---|
| Gusciora Robert | $825,000 | -- | |
| Tegelein John | $300,000 | -- | |
| Camisa Robert | $33,000 | -- |
Source: Public Records
Mortgage History
| Date | Status | Borrower | Loan Amount |
|---|---|---|---|
| Open | Gusciora Robert | $500,000 | |
| Previous Owner | Tegelein John | $200,000 |
Source: Public Records
Tax History Compared to Growth
Tax History
| Year | Tax Paid | Tax Assessment Tax Assessment Total Assessment is a certain percentage of the fair market value that is determined by local assessors to be the total taxable value of land and additions on the property. | Land | Improvement |
|---|---|---|---|---|
| 2025 | $13,504 | $1,120,700 | $530,400 | $590,300 |
| 2024 | $12,877 | $1,120,700 | $530,400 | $590,300 |
| 2023 | $11,868 | $1,120,700 | $530,400 | $590,300 |
| 2022 | $11,868 | $1,120,700 | $530,400 | $590,300 |
| 2021 | $11,812 | $1,120,700 | $530,400 | $590,300 |
| 2020 | $11,846 | $1,120,700 | $530,400 | $590,300 |
| 2019 | $11,857 | $1,120,700 | $530,400 | $590,300 |
| 2018 | $11,879 | $1,120,700 | $530,400 | $590,300 |
| 2017 | $11,106 | $1,120,700 | $530,400 | $590,300 |
| 2016 | $10,949 | $989,100 | $479,400 | $509,700 |
| 2015 | $10,682 | $479,400 | $479,400 | $0 |
| 2014 | $8,714 | $807,600 | $479,400 | $328,200 |
Source: Public Records
Map
Nearby Homes
- 615 Barnegat Ave
- 249 S 2nd St
- 373 N 2nd St
- 294 N 2nd St
- 322 N 3rd St
- 2572 E East Bay Ave
- 401 Boulevard Unit 306
- 401 Boulevard Unit 506
- 401 Boulevard Unit 503
- 401 Boulevard Unit 205
- 401 Boulevard Unit 202
- 2 Northeast Dr
- 108 W 10th St
- 333 N 5th St
- 11 S 3rd St
- 28 Division Ave
- 1306 Barnegat Ave
- 1001 Ocean Ave Unit 1017
- 1001 Ocean Ave Unit 1012
- 6 N 4th St