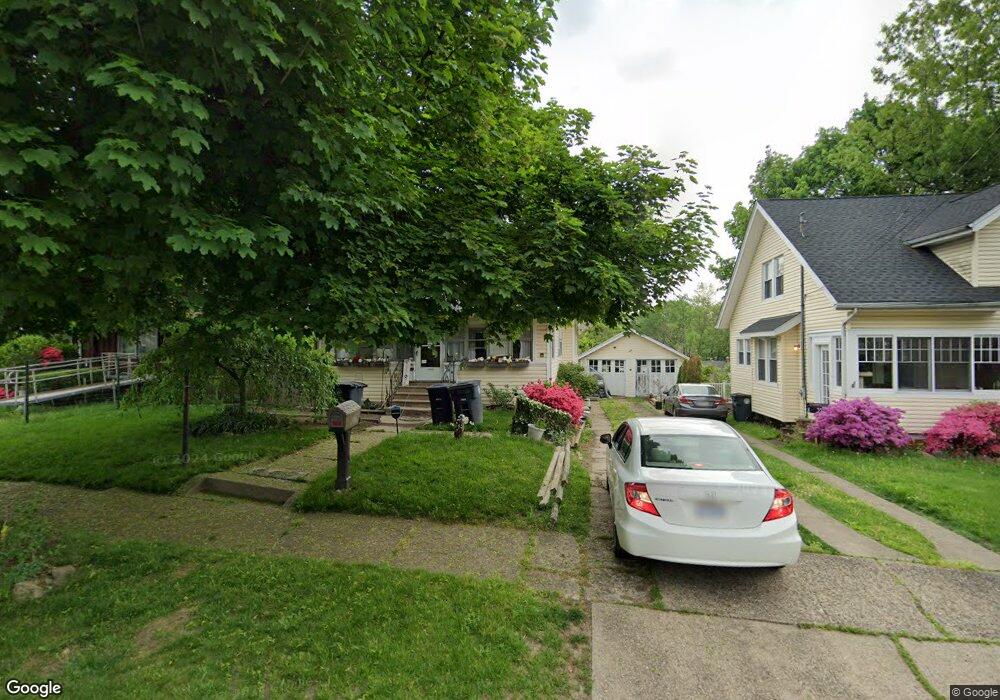
359 Watson St Akron, OH 44305
Goodyear Heights NeighborhoodEstimated Value: $122,000 - $156,000
4
Beds
2
Baths
1,440
Sq Ft
$94/Sq Ft
Est. Value
About This Home
This home is located at 359 Watson St, Akron, OH 44305 and is currently estimated at $134,710, approximately $93 per square foot. 359 Watson St is a home located in Summit County with nearby schools including Seiberling Community Learning Center, Akron Preparatory school, and Middlebury Academy.
Ownership History
Date
Name
Owned For
Owner Type
Purchase Details
Closed on
Feb 28, 2023
Sold by
Davey Christopher J
Bought by
Davey Mary R
Current Estimated Value
Purchase Details
Closed on
Mar 16, 2021
Sold by
Lewis Mary R
Bought by
Davey Mary R and Davey Christopher J
Purchase Details
Closed on
Sep 7, 2017
Sold by
Pleli Mary Donna
Bought by
Lewis Mary R
Home Financials for this Owner
Home Financials are based on the most recent Mortgage that was taken out on this home.
Original Mortgage
$30,000
Interest Rate
3.78%
Mortgage Type
Purchase Money Mortgage
Purchase Details
Closed on
Jul 21, 2017
Sold by
Pleli Mary Donna and Pleli John
Bought by
Pleli Mary Donna
Home Financials for this Owner
Home Financials are based on the most recent Mortgage that was taken out on this home.
Original Mortgage
$30,000
Interest Rate
3.78%
Mortgage Type
Purchase Money Mortgage
Create a Home Valuation Report for This Property
The Home Valuation Report is an in-depth analysis detailing your home's value as well as a comparison with similar homes in the area
Home Values in the Area
Average Home Value in this Area
Purchase History
| Date | Buyer | Sale Price | Title Company |
|---|---|---|---|
| Davey Mary R | -- | -- | |
| Davey Mary R | -- | None Available | |
| Lewis Mary R | $30,000 | None Available | |
| Pleli Mary Donna | -- | None Available |
Source: Public Records
Mortgage History
| Date | Status | Borrower | Loan Amount |
|---|---|---|---|
| Previous Owner | Lewis Mary R | $30,000 |
Source: Public Records
Tax History Compared to Growth
Tax History
| Year | Tax Paid | Tax Assessment Tax Assessment Total Assessment is a certain percentage of the fair market value that is determined by local assessors to be the total taxable value of land and additions on the property. | Land | Improvement |
|---|---|---|---|---|
| 2024 | $1,383 | $34,336 | $7,298 | $27,038 |
| 2023 | $1,383 | $34,336 | $7,298 | $27,038 |
| 2022 | $1,706 | $24,739 | $5,177 | $19,562 |
| 2021 | $1,780 | $24,739 | $5,177 | $19,562 |
| 2020 | $1,754 | $24,740 | $5,180 | $19,560 |
| 2019 | $1,700 | $21,690 | $5,500 | $16,190 |
| 2018 | $1,678 | $21,690 | $5,500 | $16,190 |
| 2017 | $1,012 | $21,690 | $5,500 | $16,190 |
| 2016 | $1,013 | $21,690 | $5,500 | $16,190 |
| 2015 | $1,012 | $21,690 | $5,500 | $16,190 |
| 2014 | $1,004 | $21,690 | $5,500 | $16,190 |
| 2013 | $1,141 | $23,950 | $5,500 | $18,450 |
Source: Public Records
Map
Nearby Homes
- 1581 Hillside Terrace
- 465 Saint Leger Ave
- 1603 Hampton Rd
- 1589 Hampton Rd
- 1551 Preston Ave
- 1604 Hampton Rd
- 248 Malacca St
- 1826 Hillside Terrace
- 1773 Marks Ave
- 554 Morningview Ave
- 1726 Shaw Ave
- 295 Goodview Ave
- 1813 Adelaide Blvd
- 1442 Hillside Terrace
- 561 Melrose St
- 1874 Adelaide Blvd
- 1430 Ottawa Ave
- 583 Sumatra Ave
- 1438 Newton St
- 153 Cutler Pkwy
- 365 Watson St
- 355 Watson St
- 369 Watson St
- 349 Watson St
- 360 Saint Leger Ave
- 366 Saint Leger Ave
- 356 Saint Leger Ave
- 345 Watson St
- 375 Watson St
- 370 Saint Leger Ave
- 350 Saint Leger Ave
- 360 Watson St
- 354 Watson St
- 364 Watson St
- 374 Watson St
- 346 Saint Leger Ave
- 376 Saint Leger Ave
- 339 Watson St
- 370 Watson St
- 348 Watson St